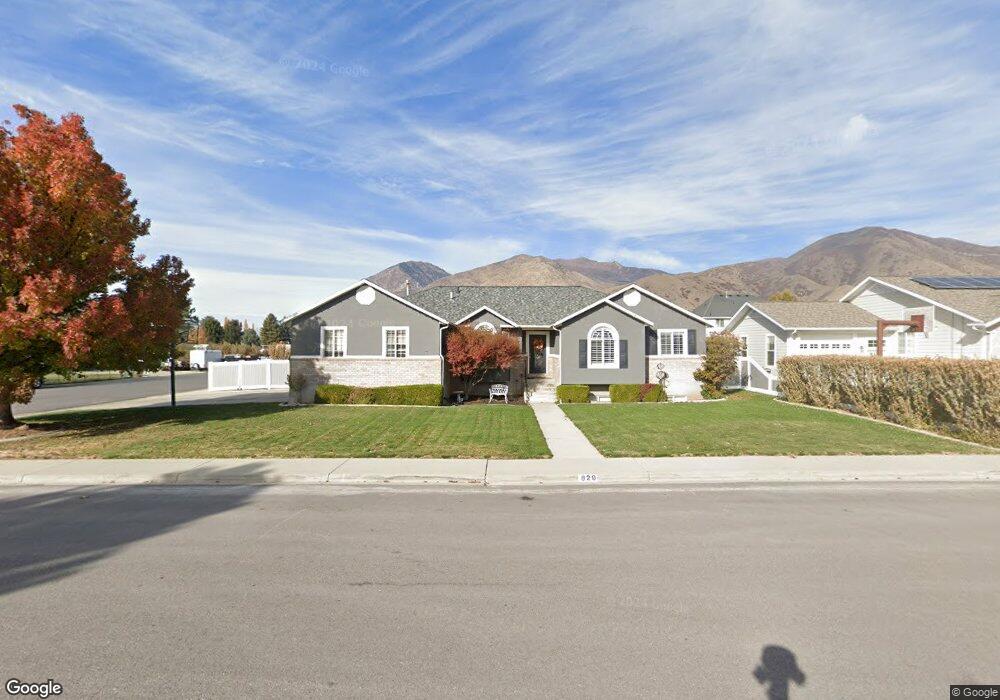
829 E 700 N Mapleton, UT 84664
Estimated Value: $717,000 - $766,000
5
Beds
3
Baths
3,509
Sq Ft
$211/Sq Ft
Est. Value
About This Home
This home is located at 829 E 700 N, Mapleton, UT 84664 and is currently estimated at $741,383, approximately $211 per square foot. 829 E 700 N is a home located in Utah County with nearby schools including Hobble Creek School, Mapleton Junior High School, and Maple Mountain High School.
Ownership History
Date
Name
Owned For
Owner Type
Purchase Details
Closed on
Nov 25, 2002
Sold by
Sandland Nathan L and Sandland Jennifer O
Bought by
Wolfgramm Lui T and Wolfgramm Shannon
Current Estimated Value
Home Financials for this Owner
Home Financials are based on the most recent Mortgage that was taken out on this home.
Original Mortgage
$182,240
Outstanding Balance
$77,605
Interest Rate
6.12%
Estimated Equity
$663,778
Purchase Details
Closed on
Dec 24, 1999
Sold by
Colyar Michael A and Colyar Amanda F
Bought by
Sandland Nathan L and Sandland Jennifer O
Home Financials for this Owner
Home Financials are based on the most recent Mortgage that was taken out on this home.
Original Mortgage
$120,000
Interest Rate
7.83%
Create a Home Valuation Report for This Property
The Home Valuation Report is an in-depth analysis detailing your home's value as well as a comparison with similar homes in the area
Home Values in the Area
Average Home Value in this Area
Purchase History
| Date | Buyer | Sale Price | Title Company |
|---|---|---|---|
| Wolfgramm Lui T | -- | Equity Title Agency Inc | |
| Sandland Nathan L | -- | First American Title Co |
Source: Public Records
Mortgage History
| Date | Status | Borrower | Loan Amount |
|---|---|---|---|
| Open | Wolfgramm Lui T | $182,240 | |
| Previous Owner | Sandland Nathan L | $120,000 |
Source: Public Records
Tax History
| Year | Tax Paid | Tax Assessment Tax Assessment Total Assessment is a certain percentage of the fair market value that is determined by local assessors to be the total taxable value of land and additions on the property. | Land | Improvement |
|---|---|---|---|---|
| 2025 | $3,213 | $347,270 | -- | -- |
| 2024 | $3,213 | $314,765 | $0 | $0 |
| 2023 | $3,326 | $327,910 | $0 | $0 |
| 2022 | $3,785 | $368,940 | $0 | $0 |
| 2021 | $3,199 | $478,800 | $161,100 | $317,700 |
| 2020 | $3,180 | $460,300 | $142,600 | $317,700 |
| 2019 | $2,829 | $418,000 | $136,900 | $281,100 |
| 2018 | $2,675 | $376,300 | $115,200 | $261,100 |
| 2017 | $2,541 | $189,695 | $0 | $0 |
| 2016 | $2,404 | $178,420 | $0 | $0 |
| 2015 | $2,338 | $172,480 | $0 | $0 |
| 2014 | $2,228 | $161,370 | $0 | $0 |
Source: Public Records
Map
Nearby Homes
- 775 N 800 E
- 594 E 1000 N
- 1096 N 1000 E
- 435 E 1000 N
- 310 N 800 E
- 265 E 600 N
- 162 N 800 E
- 141 N 600 E
- 745 E Maple St
- 1447 N 1350 St E Unit 5
- 1577 N 1350 St E Unit 1
- 1477 N 1350 St E Unit 4
- 1547 N 1350 St E Unit 2
- 1511 N 1350 St E Unit 3
- 1377 E Maple St
- 1548 N 1350 St E Unit 11
- 1578 N 1350 St E Unit 12
- 84 E 530 N
- 1567 N 600 E Unit 26
- 415 E Maple St
Your Personal Tour Guide
Ask me questions while you tour the home.