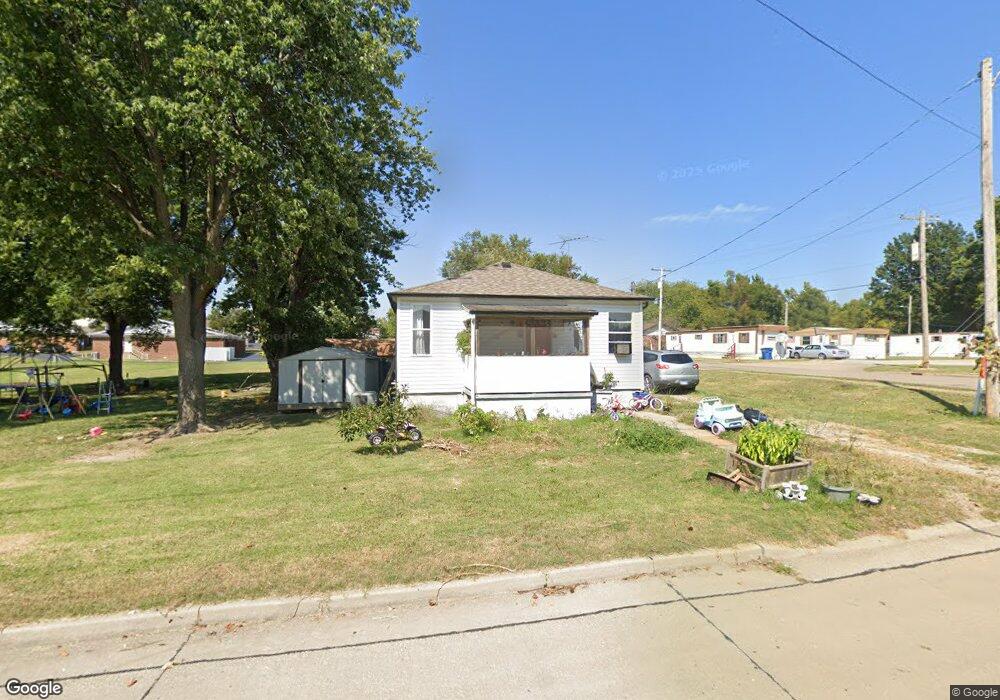
829 E McClurken Ave Sparta, IL 62286
Estimated Value: $65,000 - $116,000
2
Beds
1
Bath
900
Sq Ft
$89/Sq Ft
Est. Value
About This Home
This home is located at 829 E McClurken Ave, Sparta, IL 62286 and is currently estimated at $80,523, approximately $89 per square foot. 829 E McClurken Ave is a home located in Randolph County with nearby schools including Sparta High School.
Ownership History
Date
Name
Owned For
Owner Type
Purchase Details
Closed on
Dec 16, 2013
Sold by
Luthy Kevin
Bought by
Martin Christopher D
Current Estimated Value
Home Financials for this Owner
Home Financials are based on the most recent Mortgage that was taken out on this home.
Original Mortgage
$35,838
Outstanding Balance
$27,090
Interest Rate
4.5%
Mortgage Type
FHA
Estimated Equity
$53,433
Purchase Details
Closed on
Dec 21, 2006
Sold by
Wacker Kay R
Bought by
Luthy Kevin R
Purchase Details
Closed on
Jun 7, 2005
Sold by
Union Planters Bank Na
Bought by
Wacker Kay R
Purchase Details
Closed on
Aug 24, 2004
Sold by
Baker James R and Baker Judy K
Bought by
Union Planters Bank Na
Create a Home Valuation Report for This Property
The Home Valuation Report is an in-depth analysis detailing your home's value as well as a comparison with similar homes in the area
Home Values in the Area
Average Home Value in this Area
Purchase History
| Date | Buyer | Sale Price | Title Company |
|---|---|---|---|
| Martin Christopher D | $36,500 | None Available | |
| Luthy Kevin R | $15,000 | None Available | |
| Wacker Kay R | $10,000 | Benchmark Title Company | |
| Union Planters Bank Na | -- | None Available |
Source: Public Records
Mortgage History
| Date | Status | Borrower | Loan Amount |
|---|---|---|---|
| Open | Martin Christopher D | $35,838 |
Source: Public Records
Tax History Compared to Growth
Tax History
| Year | Tax Paid | Tax Assessment Tax Assessment Total Assessment is a certain percentage of the fair market value that is determined by local assessors to be the total taxable value of land and additions on the property. | Land | Improvement |
|---|---|---|---|---|
| 2024 | $1,029 | $16,850 | $3,360 | $13,490 |
| 2023 | $916 | $15,655 | $3,120 | $12,535 |
| 2022 | $671 | $13,850 | $1,315 | $12,535 |
| 2021 | $659 | $12,945 | $1,230 | $11,715 |
| 2020 | $632 | $13,257 | $1,261 | $11,996 |
| 2019 | $613 | $11,865 | $1,130 | $10,735 |
| 2018 | $605 | $13,081 | $1,246 | $11,835 |
| 2017 | $532 | $11,970 | $1,140 | $10,830 |
| 2016 | $583 | $11,535 | $1,100 | $10,435 |
| 2015 | $1,007 | $11,535 | $1,100 | $10,435 |
| 2014 | $1,007 | $11,760 | $1,120 | $10,640 |
| 2013 | $344 | $4,275 | $1,135 | $3,140 |
Source: Public Records
Map
Nearby Homes
- 540 E Broadway St
- 1019 E Broadway St
- 510 E Main St
- 216 S Dickey St
- 1019 E Main St
- 712 E Harrison St
- 105 S Washington
- 520 E Mound St
- 321 S Market St
- 140&142 W Broadway
- 115 W 4th St
- 332 S Saint Louis St
- 410 S Saint Louis St
- 501 N Market St
- 515 N Market St
- 336 W Jackson St
- 801 N Market St
- 255 Delwood Dr
- 500 S Chester St
- 1125 N Market St
- 301 S Burns Ave
- 820 E McClurken Ave
- 743/47 McClurken St
- 300 S Burns Ave
- 305 S Burns Ave
- 290 S Burns Ave
- 232 S Dewey St
- 212 S Burns Ave
- 224 S Dewey St
- 612 E Broadway St
- 231 S Dewey St
- 233 S Dewey St
- 209 S Burns Ave
- 225 S Dewey St
- 221 S Dewey St
- 614 E Broadway St
- 215 S Dewey St
- 206 S Dewey St
- 908 E Broadway St
- 209 S Dewey St