Estimated Value: $397,962 - $431,000
4
Beds
2
Baths
2,357
Sq Ft
$177/Sq Ft
Est. Value
About This Home
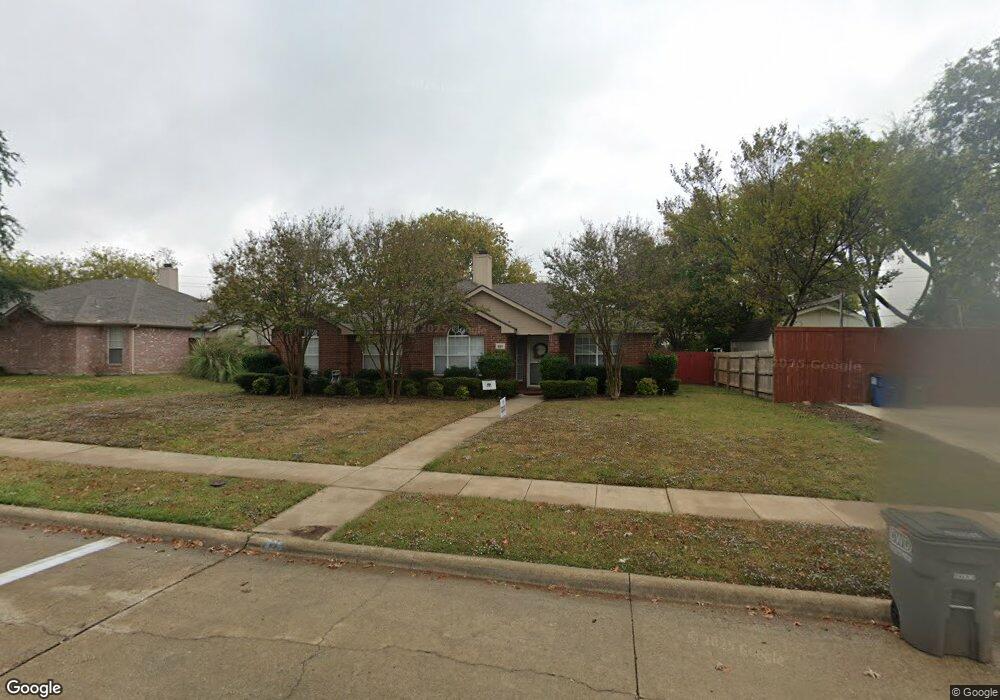
This home is located at 829 Foxwood Ln, Wylie, TX 75098 and is currently estimated at $418,241, approximately $177 per square foot. 829 Foxwood Ln is a home located in Collin County with nearby schools including P M Akin Elementary School, AB Harrison Intermediate School, and Grady Burnett J High School.
Ownership History
Date
Name
Owned For
Owner Type
Purchase Details
Closed on
Nov 4, 2015
Sold by
Benners Andrea Lynn Henderson and Henderson Andrea Lynn
Bought by
Housewright Betty Bozman
Current Estimated Value
Purchase Details
Closed on
Jul 28, 2011
Sold by
Henderson John Lynn
Bought by
Henderson Andrea Lynn
Purchase Details
Closed on
Jan 9, 2009
Sold by
Phipps Frances
Bought by
Henderson Andrea Lynn
Home Financials for this Owner
Home Financials are based on the most recent Mortgage that was taken out on this home.
Original Mortgage
$138,700
Interest Rate
5.99%
Mortgage Type
Purchase Money Mortgage
Purchase Details
Closed on
Jan 25, 1999
Sold by
Ramey Bobby G and Ramey Betty A
Bought by
Phipps Clark M and Phipps Frances
Create a Home Valuation Report for This Property
The Home Valuation Report is an in-depth analysis detailing your home's value as well as a comparison with similar homes in the area
Home Values in the Area
Average Home Value in this Area
Purchase History
| Date | Buyer | Sale Price | Title Company |
|---|---|---|---|
| Housewright Betty Bozman | -- | Ltic | |
| Henderson Andrea Lynn | -- | None Available | |
| Henderson Andrea Lynn | -- | Ct | |
| Phipps Clark M | -- | -- |
Source: Public Records
Mortgage History
| Date | Status | Borrower | Loan Amount |
|---|---|---|---|
| Previous Owner | Henderson Andrea Lynn | $138,700 | |
| Closed | Henderson Andrea Lynn | $0 |
Source: Public Records
Tax History Compared to Growth
Tax History
| Year | Tax Paid | Tax Assessment Tax Assessment Total Assessment is a certain percentage of the fair market value that is determined by local assessors to be the total taxable value of land and additions on the property. | Land | Improvement |
|---|---|---|---|---|
| 2025 | $8,182 | $375,604 | $100,000 | $275,604 |
| 2024 | $8,182 | $414,281 | $100,000 | $314,281 |
| 2023 | $8,182 | $407,536 | $100,000 | $307,536 |
| 2022 | $7,558 | $344,484 | $80,000 | $264,484 |
| 2021 | $6,534 | $277,715 | $70,000 | $207,715 |
| 2020 | $6,560 | $264,212 | $55,000 | $209,212 |
| 2019 | $7,254 | $276,025 | $55,000 | $221,025 |
| 2018 | $7,322 | $271,873 | $55,000 | $216,873 |
| 2017 | $6,505 | $241,556 | $45,000 | $196,556 |
| 2016 | $5,488 | $197,501 | $35,000 | $162,501 |
| 2015 | $4,570 | $185,683 | $35,000 | $150,683 |
Source: Public Records
Map
Nearby Homes
- 825 Foxwood Ln
- 820 Foxwood Ln
- 216 Cedar Ridge St
- 825 Forest Edge Ln
- 409 Cedar Ridge Dr
- 811 Forest Edge Ln
- 104 Rushcreek Dr
- 306 Foxwood Ct
- 1209 Surrey Cir
- 306 Woodhollow Ct
- 1201 E Stone Rd
- 416 Dogwood Dr
- 300 Woodhollow Ct
- 304 Hawthorn Dr
- 114 Liberty Dr
- 312 Maltese Cir
- 310 Hawthorn Dr
- 414 Briarwood Dr
- 327 S 4th St
- 1056 Fairview Dr
- 827 Foxwood Ln
- 901 Foxwood Ln
- 306 Cedar Ridge St
- 304 Cedar Ridge St
- 400 Cedar Ridge St
- 302 Cedar Ridge St
- 900 Foxwood Ln
- 905 Foxwood Ln
- 826 Foxwood Ln
- 402 Cedar Ridge St
- 823 Foxwood Ln
- 300 Cedar Ridge St
- 824 Foxwood Ln
- 904 Foxwood Ln
- 404 Cedar Ridge Dr
- 406 Cedar Ridge Dr
- 822 Foxwood Ln
- 909 Foxwood Ln
- 305 Cedar Ridge St
- 303 Cedar Ridge St