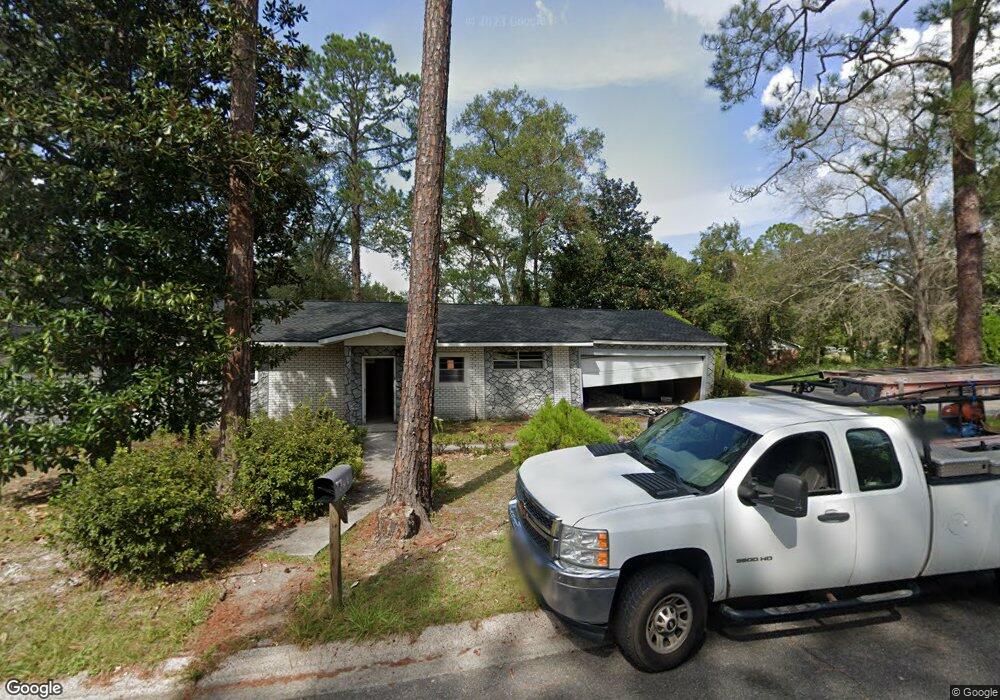
829 Homer St Waycross, GA 31501
Estimated Value: $78,000 - $123,668
3
Beds
2
Baths
1,630
Sq Ft
$67/Sq Ft
Est. Value
About This Home
This home is located at 829 Homer St, Waycross, GA 31501 and is currently estimated at $108,417, approximately $66 per square foot. 829 Homer St is a home located in Ware County with nearby schools including Memorial Drive Elementary School, Waycross Middle School, and Ware County High School.
Ownership History
Date
Name
Owned For
Owner Type
Purchase Details
Closed on
Jun 9, 2020
Sold by
Rivers Yolanda
Bought by
Rivers & Associates Property Management
Current Estimated Value
Home Financials for this Owner
Home Financials are based on the most recent Mortgage that was taken out on this home.
Original Mortgage
$38,040
Interest Rate
3.2%
Mortgage Type
New Conventional
Purchase Details
Closed on
Nov 16, 2015
Sold by
Noss Onnie
Bought by
Moss Douglas G
Purchase Details
Closed on
Aug 11, 2015
Sold by
Montgomery Sharmaine T
Bought by
Rivers Yolanda
Home Financials for this Owner
Home Financials are based on the most recent Mortgage that was taken out on this home.
Original Mortgage
$45,000
Interest Rate
4.16%
Mortgage Type
New Conventional
Purchase Details
Closed on
Aug 24, 2009
Sold by
Montgomery Lawanna H
Bought by
Montgomery Sharmane T and Hall Sherman Edward
Purchase Details
Closed on
Jul 24, 2000
Sold by
Montgomery Chester R
Bought by
Montgomery Lawanna H
Create a Home Valuation Report for This Property
The Home Valuation Report is an in-depth analysis detailing your home's value as well as a comparison with similar homes in the area
Home Values in the Area
Average Home Value in this Area
Purchase History
| Date | Buyer | Sale Price | Title Company |
|---|---|---|---|
| Rivers & Associates Property Management | -- | -- | |
| Moss Douglas G | -- | -- | |
| Rivers Yolanda | $45,000 | -- | |
| Montgomery Sharmane T | -- | -- | |
| Montgomery Lawanna H | -- | -- |
Source: Public Records
Mortgage History
| Date | Status | Borrower | Loan Amount |
|---|---|---|---|
| Closed | Rivers & Associates Property Management | $38,040 | |
| Previous Owner | Rivers Yolanda | $45,000 |
Source: Public Records
Tax History Compared to Growth
Tax History
| Year | Tax Paid | Tax Assessment Tax Assessment Total Assessment is a certain percentage of the fair market value that is determined by local assessors to be the total taxable value of land and additions on the property. | Land | Improvement |
|---|---|---|---|---|
| 2024 | $1,428 | $37,964 | $1,610 | $36,354 |
| 2023 | $1,309 | $28,591 | $2,482 | $26,109 |
| 2022 | $1,139 | $28,591 | $2,482 | $26,109 |
| 2021 | $1,123 | $25,970 | $2,482 | $23,488 |
| 2020 | $1,087 | $24,948 | $2,482 | $22,466 |
| 2019 | $1,058 | $23,927 | $2,482 | $21,445 |
| 2018 | $1,022 | $22,906 | $2,482 | $20,424 |
| 2017 | $785 | $22,906 | $2,482 | $20,424 |
| 2016 | $785 | $22,906 | $2,482 | $20,424 |
| 2015 | $1,006 | $22,905 | $2,482 | $20,424 |
| 2014 | $995 | $22,690 | $2,482 | $20,208 |
| 2013 | -- | $26,538 | $2,481 | $24,057 |
Source: Public Records
Map
Nearby Homes
- 615 Morton Ave
- 0 Marion St
- 0 Cabinet St
- 1316 Blackwell St
- 1021 Lee Ave
- 924 Highsmith St
- 705 Gilmore St
- 805 Brunel St
- 306 Lee Ave
- 403 Pendergast St
- 1304 Brunel St
- 418 Reed St
- 0 Goodwin St
- 502 Dewey St
- 415 Dewey St
- 201 Washington Ave
- 0 Memorial Dr Unit 163971
- 7059 Thornbird Rd
- 1808 Brunel St
- 506 Magnolia Dr