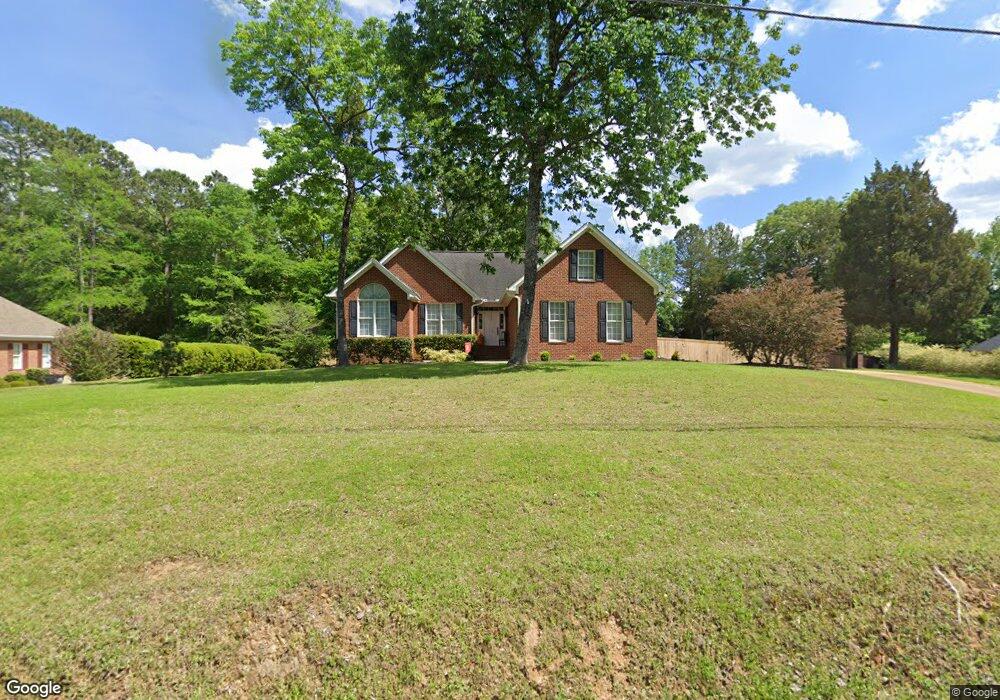
829 Indian Fork Rd Chapin, SC 29036
Estimated Value: $277,000 - $434,000
4
Beds
2
Baths
2,170
Sq Ft
$173/Sq Ft
Est. Value
About This Home
This home is located at 829 Indian Fork Rd, Chapin, SC 29036 and is currently estimated at $374,399, approximately $172 per square foot. 829 Indian Fork Rd is a home located in Lexington County with nearby schools including Lake Murray Elementary School, Chapin Intermediate, and Chapin High School.
Ownership History
Date
Name
Owned For
Owner Type
Purchase Details
Closed on
Jul 1, 2020
Sold by
Mcmahon James F and Mcmahon Julie L
Bought by
Mcmahon James F and Mcmahon Julie L
Current Estimated Value
Purchase Details
Closed on
Apr 6, 2018
Sold by
Havens Roger D and Havens Sandra J
Bought by
Mcmahon James F and Mcmahon Julie L
Home Financials for this Owner
Home Financials are based on the most recent Mortgage that was taken out on this home.
Original Mortgage
$189,600
Outstanding Balance
$159,328
Interest Rate
3.5%
Mortgage Type
Adjustable Rate Mortgage/ARM
Estimated Equity
$215,071
Purchase Details
Closed on
Jun 30, 2006
Sold by
Muckey Jeffery D and Muckey Mary E
Bought by
Havens Roger D and Havens Sandra J
Home Financials for this Owner
Home Financials are based on the most recent Mortgage that was taken out on this home.
Original Mortgage
$199,200
Interest Rate
6.55%
Mortgage Type
New Conventional
Purchase Details
Closed on
May 14, 2001
Sold by
Twins Inc
Bought by
Christie Cons Co Inc
Create a Home Valuation Report for This Property
The Home Valuation Report is an in-depth analysis detailing your home's value as well as a comparison with similar homes in the area
Home Values in the Area
Average Home Value in this Area
Purchase History
| Date | Buyer | Sale Price | Title Company |
|---|---|---|---|
| Mcmahon James F | -- | None Available | |
| Mcmahon James F | $237,000 | None Available | |
| Havens Roger D | $249,000 | None Available | |
| Christie Cons Co Inc | $25,000 | -- |
Source: Public Records
Mortgage History
| Date | Status | Borrower | Loan Amount |
|---|---|---|---|
| Open | Mcmahon James F | $189,600 | |
| Previous Owner | Havens Roger D | $199,200 |
Source: Public Records
Tax History Compared to Growth
Tax History
| Year | Tax Paid | Tax Assessment Tax Assessment Total Assessment is a certain percentage of the fair market value that is determined by local assessors to be the total taxable value of land and additions on the property. | Land | Improvement |
|---|---|---|---|---|
| 2024 | $1,314 | $10,217 | $1,400 | $8,817 |
| 2023 | $1,172 | $10,217 | $1,400 | $8,817 |
| 2022 | $1,197 | $10,217 | $1,400 | $8,817 |
| 2020 | $1,258 | $10,217 | $1,400 | $8,817 |
| 2019 | $1,160 | $9,480 | $1,200 | $8,280 |
| 2018 | $995 | $9,354 | $1,200 | $8,154 |
| 2017 | $1,319 | $9,354 | $1,200 | $8,154 |
| 2016 | $1,352 | $9,354 | $1,200 | $8,154 |
| 2014 | $1,331 | $9,234 | $920 | $8,314 |
| 2013 | -- | $9,240 | $920 | $8,320 |
Source: Public Records
Map
Nearby Homes
- 24 Clay Ct
- 129 Forest Bickley Rd
- 435 Whits End
- 304 Racket Rd
- 306 Dolly Horn Ln
- 138 Sunsation Dr
- 311 Pebblebranch Dr
- 2515 Wessinger Rd
- 2544 Wessinger Rd
- 239 Pebblebranch Dr
- 403 Rising Stream Way
- 110 Lake Hilton Dr
- 387 Rising Stream Way
- 366 Rising Stream Way
- 362 Rising Stream Way
- 415 Rising Stream Way
- 407 Rising Stream Way
- 345 Rising Stream Way
- 1216 Cypress Valley Dr
- 419 Rising Stream Way
- 825 Indian Fork Rd
- 835 Indian Fork Rd
- 112 Old Sawmill Trail
- 110 Old Sawmill Trail
- 828 Indian Fork Rd
- 114 Old Sawmill Trail
- 108 Old Sawmill Trail
- 116 Old Sawmill Trail
- 811 Indian Fork Rd
- 847 Indian Fork Rd
- 806 Indian Fork Rd
- 106 Old Sawmill Trail
- 111 Old Sawmill Trail
- 109 Old Sawmill Trail
- 853 Indian Fork Rd
- 852 Indian Fork Rd
- 115 Old Sawmill Trail
- 104 Old Sawmill Trail
- 113 Old Sawmill Trail
- 2220 Island Trail