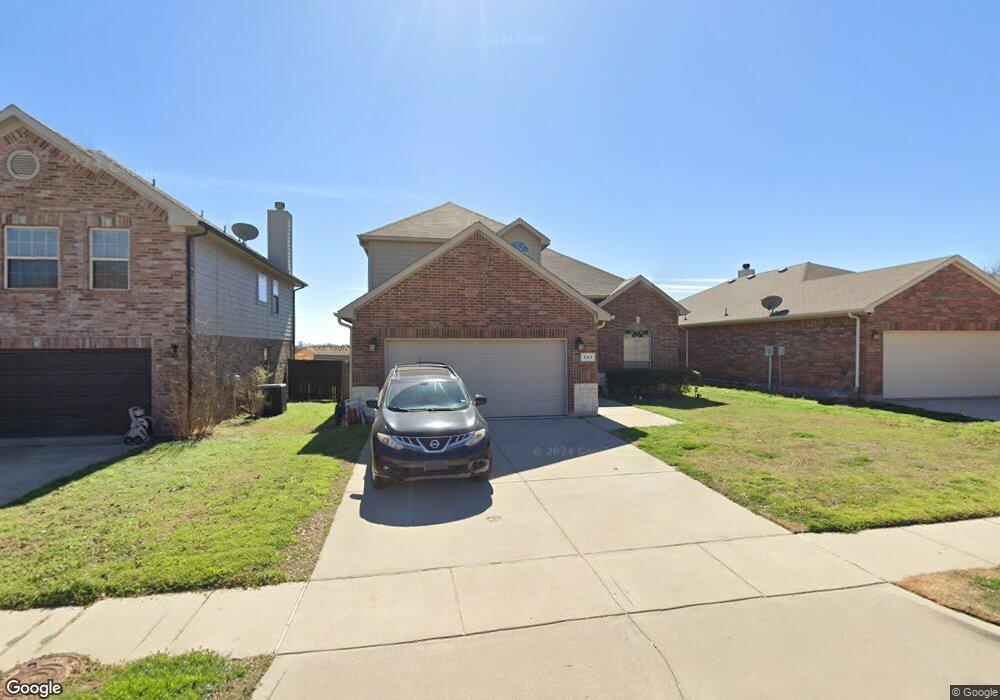
829 Jodie Dr Weatherford, TX 76087
Estimated Value: $373,000 - $380,000
4
Beds
3
Baths
2,421
Sq Ft
$155/Sq Ft
Est. Value
About This Home
This home is located at 829 Jodie Dr, Weatherford, TX 76087 and is currently estimated at $375,169, approximately $154 per square foot. 829 Jodie Dr is a home located in Parker County with nearby schools including Curtis Elementary School, Hall Middle School, and Weatherford High School.
Ownership History
Date
Name
Owned For
Owner Type
Purchase Details
Closed on
Aug 14, 2020
Sold by
Rahbarzare Ruby Lea
Bought by
Franklin Chris and Franklin Lisa
Current Estimated Value
Home Financials for this Owner
Home Financials are based on the most recent Mortgage that was taken out on this home.
Original Mortgage
$200,000
Outstanding Balance
$177,414
Interest Rate
3%
Mortgage Type
New Conventional
Estimated Equity
$197,755
Purchase Details
Closed on
Jul 23, 2010
Sold by
D R Horton Texas Ltd
Bought by
Rahbarzare Ruby Lea
Home Financials for this Owner
Home Financials are based on the most recent Mortgage that was taken out on this home.
Original Mortgage
$166,258
Interest Rate
4.75%
Mortgage Type
FHA
Purchase Details
Closed on
Sep 29, 2009
Sold by
Choice Homes Inc
Bought by
Rahbarzare Ruby L
Purchase Details
Closed on
Sep 25, 2007
Sold by
Brown Christopher
Bought by
Rahbarzare Ruby L
Create a Home Valuation Report for This Property
The Home Valuation Report is an in-depth analysis detailing your home's value as well as a comparison with similar homes in the area
Home Values in the Area
Average Home Value in this Area
Purchase History
| Date | Buyer | Sale Price | Title Company |
|---|---|---|---|
| Franklin Chris | -- | None Available | |
| Rahbarzare Ruby Lea | -- | Dhi | |
| Rahbarzare Ruby L | -- | -- | |
| Rahbarzare Ruby L | -- | -- |
Source: Public Records
Mortgage History
| Date | Status | Borrower | Loan Amount |
|---|---|---|---|
| Open | Franklin Chris | $200,000 | |
| Previous Owner | Rahbarzare Ruby Lea | $166,258 |
Source: Public Records
Tax History Compared to Growth
Tax History
| Year | Tax Paid | Tax Assessment Tax Assessment Total Assessment is a certain percentage of the fair market value that is determined by local assessors to be the total taxable value of land and additions on the property. | Land | Improvement |
|---|---|---|---|---|
| 2025 | $5,083 | $349,218 | -- | -- |
| 2024 | $5,083 | $317,471 | -- | -- |
| 2023 | $5,083 | $288,610 | $0 | $0 |
| 2022 | $5,820 | $262,380 | $25,000 | $237,380 |
| 2021 | $6,301 | $262,380 | $25,000 | $237,380 |
| 2020 | $5,883 | $243,460 | $25,000 | $218,460 |
| 2019 | $6,217 | $243,460 | $25,000 | $218,460 |
| 2018 | $5,436 | $211,910 | $25,000 | $186,910 |
| 2017 | $5,576 | $211,910 | $25,000 | $186,910 |
| 2016 | $4,859 | $184,660 | $25,000 | $159,660 |
| 2015 | $4,758 | $184,660 | $25,000 | $159,660 |
| 2014 | $4,312 | $171,710 | $25,000 | $146,710 |
Source: Public Records
Map
Nearby Homes
- 825 Jodie Dr
- 909 Jodie Dr
- 842 Randall Rd
- 2533 Hadley St
- 914 Randall Rd
- 2532 Hadley St
- 2209 Caroline Dr
- 1036 Deer Valley Dr
- 1220 Scott Dr
- 2361 Waggoner Ranch Dr
- 2381 Waggoner Ranch Dr
- 2416 Waggoner Ranch Dr
- 3770 Bethel Rd
- 2344 Briscoe Ranch Dr
- 1015 W Park Ave Unit D
- 1015 W Park Ave Unit LOT A
- 1015 W Park Ave Unit LOT B
- 1921 Bay Laurel Dr
- 1252 Kerrville Ln
- 124 Candleridge Ct