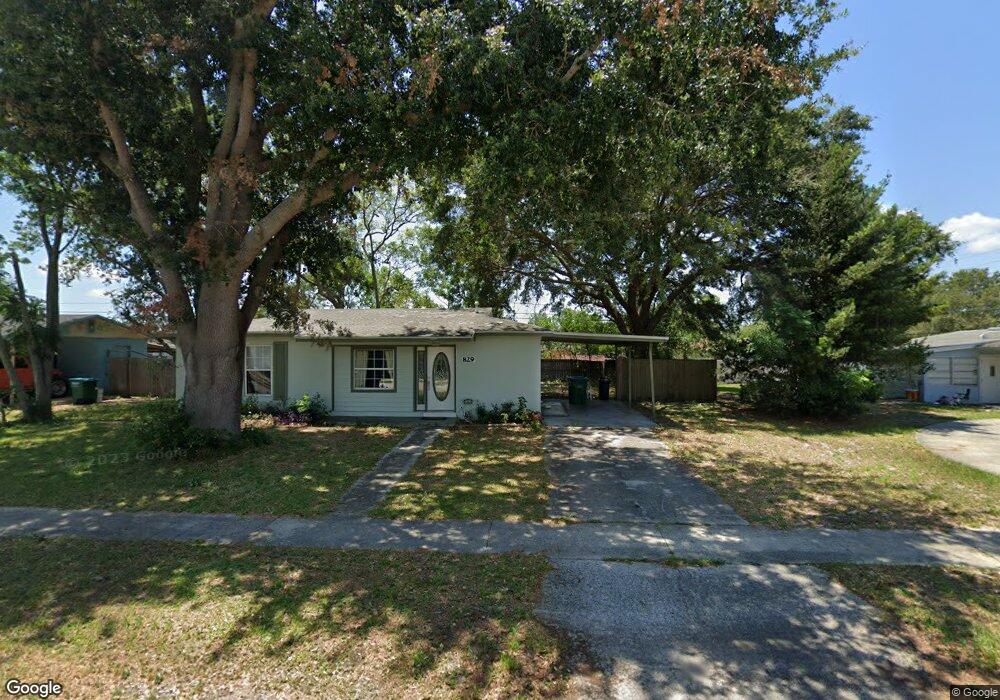
829 Merrimac St Deltona, FL 32725
Estimated Value: $207,969 - $238,000
2
Beds
1
Bath
1,024
Sq Ft
$215/Sq Ft
Est. Value
About This Home
This home is located at 829 Merrimac St, Deltona, FL 32725 and is currently estimated at $220,492, approximately $215 per square foot. 829 Merrimac St is a home located in Volusia County with nearby schools including Discovery Elementary School, Deltona Middle School, and University High School.
Ownership History
Date
Name
Owned For
Owner Type
Purchase Details
Closed on
Nov 16, 2023
Sold by
Winningham Cory D
Bought by
Homes By Anndavid Inc
Current Estimated Value
Purchase Details
Closed on
May 1, 2001
Sold by
Griggs Deborah A
Bought by
Winningham Cory D
Purchase Details
Closed on
Oct 16, 2000
Sold by
Winningham Cory D
Bought by
Griggs Deborah A
Purchase Details
Closed on
Dec 14, 1998
Sold by
Housing & Urban Dev
Bought by
Winningham Cory D
Home Financials for this Owner
Home Financials are based on the most recent Mortgage that was taken out on this home.
Original Mortgage
$25,683
Interest Rate
6.94%
Purchase Details
Closed on
Aug 18, 1998
Sold by
Norwest Mtg Inc
Bought by
Housing & Urban Dev
Purchase Details
Closed on
Jun 8, 1998
Sold by
Clerk Circuit Court
Bought by
Norwest Mtg Inc
Purchase Details
Closed on
May 15, 1992
Bought by
Winningham Cory D
Purchase Details
Closed on
Jul 15, 1985
Bought by
Winningham Cory D
Create a Home Valuation Report for This Property
The Home Valuation Report is an in-depth analysis detailing your home's value as well as a comparison with similar homes in the area
Home Values in the Area
Average Home Value in this Area
Purchase History
| Date | Buyer | Sale Price | Title Company |
|---|---|---|---|
| Homes By Anndavid Inc | $100 | None Listed On Document | |
| Homes By Anndavid Inc | $100 | None Listed On Document | |
| Winningham Cory D | -- | -- | |
| Griggs Deborah A | -- | -- | |
| Winningham Cory D | $29,600 | -- | |
| Housing & Urban Dev | -- | -- | |
| Norwest Mtg Inc | -- | -- | |
| Winningham Cory D | $39,900 | -- | |
| Winningham Cory D | $30,000 | -- |
Source: Public Records
Mortgage History
| Date | Status | Borrower | Loan Amount |
|---|---|---|---|
| Previous Owner | Winningham Cory D | $25,683 |
Source: Public Records
Tax History Compared to Growth
Tax History
| Year | Tax Paid | Tax Assessment Tax Assessment Total Assessment is a certain percentage of the fair market value that is determined by local assessors to be the total taxable value of land and additions on the property. | Land | Improvement |
|---|---|---|---|---|
| 2025 | $2,188 | $154,054 | $46,500 | $107,554 |
| 2024 | $2,188 | $154,921 | $46,500 | $108,421 |
| 2023 | $2,188 | $157,191 | $44,640 | $112,551 |
| 2022 | $1,995 | $131,094 | $36,000 | $95,094 |
| 2021 | $1,851 | $102,470 | $23,760 | $78,710 |
| 2020 | $1,706 | $90,749 | $18,720 | $72,029 |
| 2019 | $1,629 | $81,497 | $18,360 | $63,137 |
| 2018 | $1,489 | $68,707 | $12,960 | $55,747 |
| 2017 | $1,312 | $50,183 | $7,589 | $42,594 |
| 2016 | $1,174 | $40,419 | $0 | $0 |
| 2015 | -- | $39,487 | $0 | $0 |
| 2014 | -- | $31,490 | $0 | $0 |
Source: Public Records
Map
Nearby Homes
- 1468 E Lombardy Dr
- 1483 Independence Ave
- 913 Merrimac St
- 1418 Corinthian Ave
- 1417 Independence Ave
- 766 Tamerlane St
- 920 Trafalgar St
- 877 Horizon St
- 742 Trafalgar St
- 995 Merrimac St
- 1794 Saxon Blvd
- 962 Rockhill St
- 732 Waterfall Cir
- 1348 E Hancock Dr
- 691 Piedmont Dr
- 1051 Eva St
- 649 N Wellington Dr
- 812 Lily Ct
- 631 Merrimac St
- 1660 E Apache Cir
- 835 Merrimac St
- 1483 E Lombardy Dr
- 830 Henderson St
- 836 Henderson St Unit 30
- 1473 E Lombardy Dr
- 841 Merrimac St
- 832 Merrimac St
- 826 Merrimac St
- 842 Henderson St
- 838 Merrimac St
- 820 Merrimac St
- 847 Merrimac St
- 848 Henderson St
- 811 Merrimac St
- 814 Merrimac St Unit 30
- 829 Henderson St
- 1476 E Lombardy Dr
- 835 Superior St
- 827 Superior St
- 1453 E Lombardy Dr