S
Seller's Agent in 2023
Saresa Mills
Excalibur Homes, LLC
(404) 254-8823
2 Total Sales
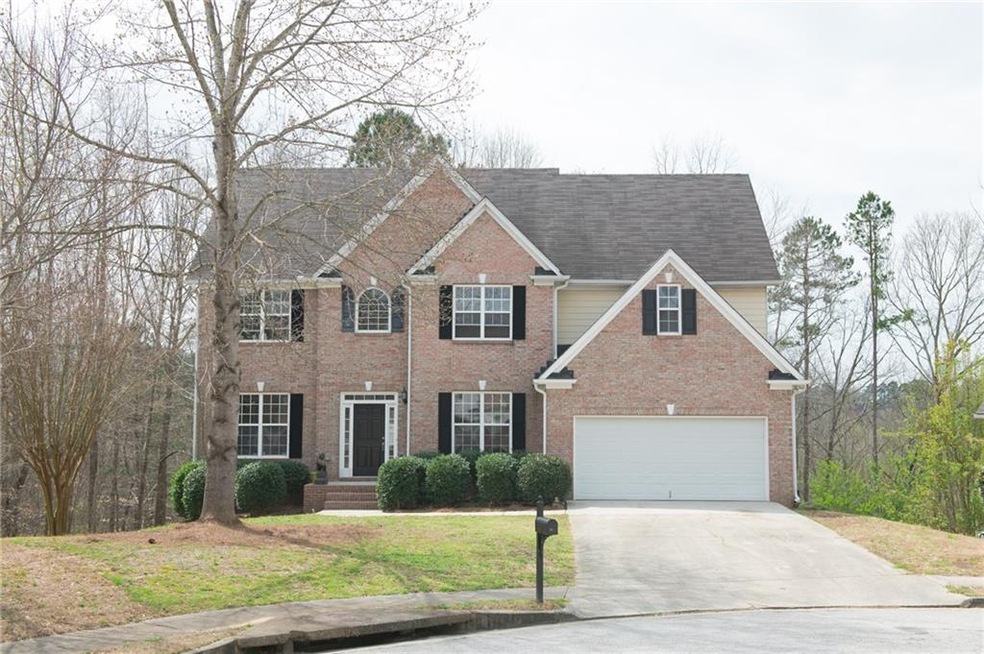
Lots of Upgrades!!! Hardwood & Marble Floors on Main !! Stained Cabinets w Granite Tops !! Freshly Painted Deck ! Finished Basement Offers 1 Bedroom w Full Bath & Large Entertainment Center...Lots of Storage space..House sits on Quiet Cul-De-Sac !! Large Master ste w Large Walk In Closet !! Great Swim/Tennis Community..
| Date | Type | Sale Price | Title Company |
|---|---|---|---|
| Warranty Deed | $432,100 | -- | |
| Warranty Deed | $299,900 | -- | |
| Deed | $287,500 | -- | |
| Deed | $287,500 | -- | |
| Deed | $240,800 | -- |
| Date | Status | Loan Amount | Loan Type |
|---|---|---|---|
| Previous Owner | $294,467 | FHA | |
| Previous Owner | $216,730 | New Conventional | |
| Previous Owner | $230,000 | New Conventional | |
| Previous Owner | $40,000 | Stand Alone Second | |
| Previous Owner | $244,700 | Stand Alone Second | |
| Previous Owner | $238,000 | Stand Alone Refi Refinance Of Original Loan | |
| Previous Owner | $228,674 | New Conventional |
| Date | Event | Price | Change | Sq Ft Price |
|---|---|---|---|---|
| 10/25/2024 10/25/24 | Off Market | $3,375 | -- | -- |
| 10/16/2024 10/16/24 | Price Changed | $3,375 | -1.7% | $1 / Sq Ft |
| 10/13/2024 10/13/24 | Price Changed | $3,435 | -1.8% | $1 / Sq Ft |
| 10/02/2024 10/02/24 | Price Changed | $3,499 | -2.5% | $1 / Sq Ft |
| 09/26/2024 09/26/24 | For Rent | $3,590 | +24.0% | -- |
| 11/07/2023 11/07/23 | Rented | $2,895 | 0.0% | -- |
| 10/20/2023 10/20/23 | Price Changed | $2,895 | -5.9% | $1 / Sq Ft |
| 10/10/2023 10/10/23 | Price Changed | $3,075 | -0.6% | $1 / Sq Ft |
| 09/27/2023 09/27/23 | Price Changed | $3,095 | -1.4% | $1 / Sq Ft |
| 09/11/2023 09/11/23 | Price Changed | $3,139 | -0.3% | $1 / Sq Ft |
| 08/18/2023 08/18/23 | Price Changed | $3,150 | -1.4% | $1 / Sq Ft |
| 07/24/2023 07/24/23 | For Rent | $3,195 | 0.0% | -- |
| 05/27/2022 05/27/22 | Rented | $3,195 | 0.0% | -- |
| 05/16/2022 05/16/22 | For Rent | $3,195 | 0.0% | -- |
| 12/06/2021 12/06/21 | Sold | $432,100 | -1.8% | $154 / Sq Ft |
| 11/03/2021 11/03/21 | Pending | -- | -- | -- |
| 10/22/2021 10/22/21 | For Sale | $439,900 | +46.7% | $157 / Sq Ft |
| 05/21/2018 05/21/18 | Sold | $299,900 | 0.0% | $81 / Sq Ft |
| 04/02/2018 04/02/18 | Pending | -- | -- | -- |
| 03/26/2018 03/26/18 | For Sale | $299,900 | -- | $81 / Sq Ft |
| Year | Tax Paid | Tax Assessment Tax Assessment Total Assessment is a certain percentage of the fair market value that is determined by local assessors to be the total taxable value of land and additions on the property. | Land | Improvement |
|---|---|---|---|---|
| 2024 | $7,620 | $205,160 | $35,200 | $169,960 |
| 2023 | $7,620 | $211,520 | $35,200 | $176,320 |
| 2022 | $6,445 | $172,840 | $28,000 | $144,840 |
| 2021 | $4,776 | $139,240 | $24,000 | $115,240 |
| 2020 | $4,391 | $119,960 | $20,000 | $99,960 |
| 2019 | $4,239 | $119,960 | $20,000 | $99,960 |
| 2018 | $4,377 | $116,400 | $20,000 | $96,400 |
| 2016 | $3,978 | $104,560 | $17,360 | $87,200 |
| 2015 | $3,424 | $87,640 | $12,000 | $75,640 |
| 2014 | -- | $87,640 | $12,000 | $75,640 |
S
Seller's Agent in 2023
Saresa Mills
Excalibur Homes, LLC
(404) 254-8823
2 Total Sales

Seller's Agent in 2021
Andrew Chong
Keller Williams Realty Atl. Partners
(678) 908-1606
23 in this area
170 Total Sales
K
Buyer's Agent in 2021
Karen Jones
Kirkwood Realty, LLC
Seller's Agent in 2018
Sunny Seo
Sunny Home Realty
(678) 755-4486
11 in this area
61 Total Sales
Buyer's Agent in 2018
Esther Chong
Keller Williams Realty Atlanta Partners
(404) 545-4446
6 in this area
25 Total Sales
Source: First Multiple Listing Service (FMLS)
MLS Number: 5985307
APN: 7-215-217
Disclaimer: Certain information contained herein is derived from information provided by parties other than Homes.com. All information provided is deemed reliable, but is not guaranteed to be accurate and should be independently verified.
![]() Listings identified with the FMLS IDX logo come from FMLS and are held by brokerage firms other than the owner of this website. The listing brokerage is identified in any listing details. Information is deemed reliable but is not guaranteed. If you believe any FMLS listing contains material that infringes your copyrighted work please visit www.fmls.com/dmca to review our DMCA policy and learn how to submit a takedown request. © 2025 First Multiple Listing Service, Inc.
Listings identified with the FMLS IDX logo come from FMLS and are held by brokerage firms other than the owner of this website. The listing brokerage is identified in any listing details. Information is deemed reliable but is not guaranteed. If you believe any FMLS listing contains material that infringes your copyrighted work please visit www.fmls.com/dmca to review our DMCA policy and learn how to submit a takedown request. © 2025 First Multiple Listing Service, Inc.