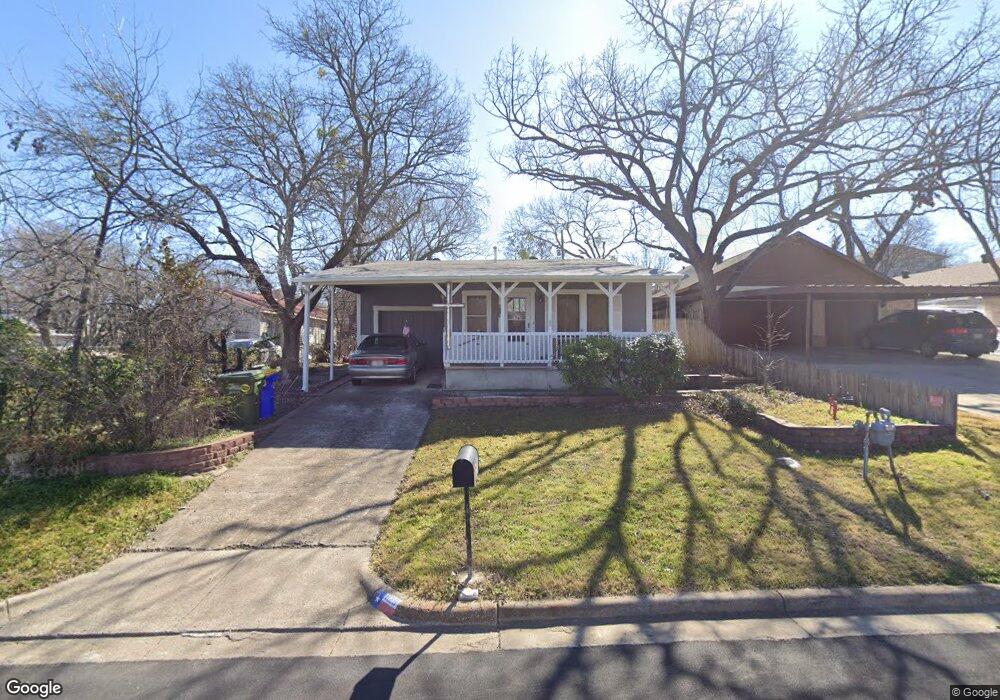
829 Rumfield Rd Fort Worth, TX 76108
Estimated Value: $185,000 - $202,000
2
Beds
1
Bath
1,104
Sq Ft
$175/Sq Ft
Est. Value
About This Home
This home is located at 829 Rumfield Rd, Fort Worth, TX 76108 and is currently estimated at $192,986, approximately $174 per square foot. 829 Rumfield Rd is a home located in Tarrant County with nearby schools including Liberty Elementary School, Brewer Middle School, and Tannahill Intermediate School.
Ownership History
Date
Name
Owned For
Owner Type
Purchase Details
Closed on
Apr 2, 2012
Sold by
Ahnert Beverly
Bought by
Ahnert Beverly
Current Estimated Value
Purchase Details
Closed on
Jan 23, 2004
Sold by
Ahnert Daniel
Bought by
Ahnert Daniel G and Ahnert Beverly L
Home Financials for this Owner
Home Financials are based on the most recent Mortgage that was taken out on this home.
Original Mortgage
$120,000
Outstanding Balance
$43,541
Interest Rate
2.7%
Mortgage Type
New Conventional
Estimated Equity
$149,445
Purchase Details
Closed on
Jun 26, 2002
Sold by
Ahnert Daniel G and Ahnert Beverly L
Bought by
Ahnert Daniel
Purchase Details
Closed on
Oct 18, 2000
Sold by
Ahnert Daniel
Bought by
Ahnert Daniel G and Ahnert Beverly L
Purchase Details
Closed on
Mar 14, 2000
Sold by
Riegel Steven Ray
Bought by
Ahnert Daniel G and Ahnert Beverly L
Create a Home Valuation Report for This Property
The Home Valuation Report is an in-depth analysis detailing your home's value as well as a comparison with similar homes in the area
Home Values in the Area
Average Home Value in this Area
Purchase History
| Date | Buyer | Sale Price | Title Company |
|---|---|---|---|
| Ahnert Beverly | -- | None Available | |
| Ahnert Daniel G | -- | First American Title | |
| Ahnert Daniel | -- | -- | |
| Ahnert Daniel G | -- | -- | |
| Ahnert Daniel G | -- | First American Title Co |
Source: Public Records
Mortgage History
| Date | Status | Borrower | Loan Amount |
|---|---|---|---|
| Open | Ahnert Daniel G | $120,000 | |
| Closed | Ahnert Daniel G | $120,000 |
Source: Public Records
Tax History Compared to Growth
Tax History
| Year | Tax Paid | Tax Assessment Tax Assessment Total Assessment is a certain percentage of the fair market value that is determined by local assessors to be the total taxable value of land and additions on the property. | Land | Improvement |
|---|---|---|---|---|
| 2025 | $280 | $187,433 | $35,000 | $152,433 |
| 2024 | $280 | $187,433 | $35,000 | $152,433 |
| 2023 | $2,095 | $170,862 | $35,000 | $135,862 |
| 2022 | $2,169 | $145,104 | $25,000 | $120,104 |
| 2021 | $2,003 | $135,909 | $25,000 | $110,909 |
| 2020 | $1,834 | $114,476 | $25,000 | $89,476 |
| 2019 | $1,731 | $115,320 | $25,000 | $90,320 |
| 2018 | $63 | $54,704 | $12,000 | $42,704 |
| 2017 | $1,453 | $81,678 | $12,000 | $69,678 |
| 2016 | $1,321 | $78,497 | $12,000 | $66,497 |
| 2015 | -- | $41,100 | $10,000 | $31,100 |
| 2014 | -- | $41,100 | $10,000 | $31,100 |
Source: Public Records
Map
Nearby Homes
- 809 Mirike Dr
- 8400 Wyatt Dr
- 8500 Wyatt Dr
- 911 Rumfield Rd
- 8237 Albert St
- 8232 Redonda St
- 633 Kimbrough St
- 872 June Dr
- 8316 Sussex St
- 8437 Redonda St
- 8508 Michael St
- 8224 Carlos St
- 8354 Sussex St
- 8203 Delmar St
- 800 Pemberton St
- 501 Pemberton St
- 801 Ala Dr
- 537 June Dr
- 8528 Pemberton Ct
- 321 Meadow Park Dr
- 825 Rumfield Rd
- 837 Rumfield Rd
- 821 Rumfield Rd
- 841 Rumfield Rd
- 814 N Ridge Dr
- 805 Rumfield Rd
- 812 N Ridge Dr
- 816 N Ridge Dr
- 810 N Ridge Dr
- 810 Rumfield Rd
- 813 Rumfield Rd
- 845 Rumfield Rd
- 808 Rumfield Rd
- 806 N Ridge Dr
- 803 Rumfield Rd
- 808 N Ridge Dr
- 806 Rumfield Rd
- 818 N Ridge Dr
- 840 Rumfield Rd
- 804 N Ridge Dr