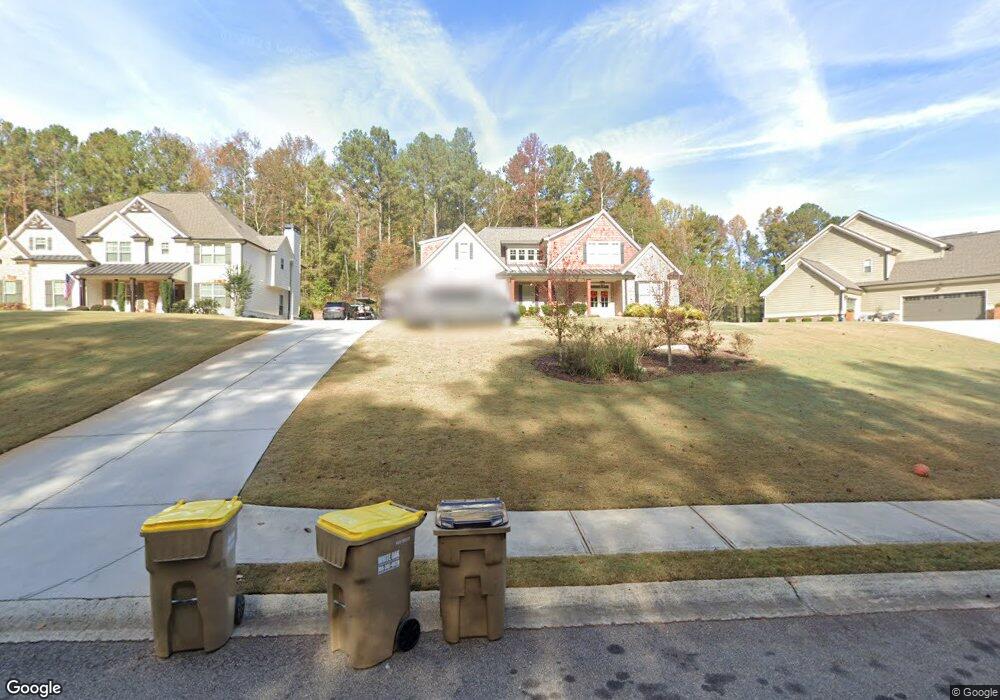
829 Walnut River Trail Unit 16B Braselton, GA 30517
Estimated Value: $586,000 - $868,000
4
Beds
3
Baths
3,594
Sq Ft
$192/Sq Ft
Est. Value
About This Home
This home is located at 829 Walnut River Trail Unit 16B, Braselton, GA 30517 and is currently estimated at $690,633, approximately $192 per square foot. 829 Walnut River Trail Unit 16B is a home located in Jackson County with nearby schools including West Jackson Elementary School, West Jackson Middle School, and Jackson County High School.
Ownership History
Date
Name
Owned For
Owner Type
Purchase Details
Closed on
Dec 20, 2024
Sold by
Green Implementation Group Llc
Bought by
Shinko Holdings Llc
Current Estimated Value
Home Financials for this Owner
Home Financials are based on the most recent Mortgage that was taken out on this home.
Original Mortgage
$583,075
Outstanding Balance
$373,686
Interest Rate
6.84%
Mortgage Type
New Conventional
Estimated Equity
$316,947
Purchase Details
Closed on
Apr 30, 2015
Sold by
Reo Funding Solutions Iii
Bought by
Green Implementation Grp Llc
Purchase Details
Closed on
Feb 1, 2011
Sold by
Canaan Heirs Llc
Bought by
Crm Central Properties Llc
Purchase Details
Closed on
Dec 29, 2005
Sold by
Chitty Charles R and David Markert
Bought by
Canaan Heirs Llc
Purchase Details
Closed on
Jun 23, 2005
Sold by
Woodruff Inc
Bought by
Markert David
Purchase Details
Closed on
Jun 23, 2004
Sold by
Franklin Thomas Etal
Bought by
Woodruff Inc
Create a Home Valuation Report for This Property
The Home Valuation Report is an in-depth analysis detailing your home's value as well as a comparison with similar homes in the area
Home Values in the Area
Average Home Value in this Area
Purchase History
| Date | Buyer | Sale Price | Title Company |
|---|---|---|---|
| Shinko Holdings Llc | $583,075 | -- | |
| Shinko Holdings Llc | $583,075 | -- | |
| Green Implementation Grp Llc | $1,617,000 | -- | |
| Crm Central Properties Llc | -- | -- | |
| Canaan Heirs Llc | -- | -- | |
| Markert David | $2,080,100 | -- | |
| Woodruff Inc | $1,571,700 | -- |
Source: Public Records
Mortgage History
| Date | Status | Borrower | Loan Amount |
|---|---|---|---|
| Open | Shinko Holdings Llc | $583,075 | |
| Closed | Shinko Holdings Llc | $583,075 |
Source: Public Records
Tax History Compared to Growth
Tax History
| Year | Tax Paid | Tax Assessment Tax Assessment Total Assessment is a certain percentage of the fair market value that is determined by local assessors to be the total taxable value of land and additions on the property. | Land | Improvement |
|---|---|---|---|---|
| 2024 | $8,009 | $294,160 | $32,000 | $262,160 |
| 2023 | $8,009 | $262,240 | $32,000 | $230,240 |
| 2022 | $5,941 | $211,000 | $32,000 | $179,000 |
| 2021 | $5,815 | $205,000 | $26,000 | $179,000 |
| 2020 | $5,084 | $162,800 | $26,000 | $136,800 |
| 2019 | $767 | $22,000 | $22,000 | $0 |
| 2018 | $777 | $22,000 | $22,000 | $0 |
| 2017 | $784 | $26,000 | $26,000 | $0 |
| 2016 | $313 | $26,000 | $26,000 | $0 |
| 2015 | $203 | $3,800 | $3,800 | $0 |
| 2014 | $204 | $3,800 | $3,800 | $0 |
| 2013 | -- | $3,800 | $3,800 | $0 |
Source: Public Records
Map
Nearby Homes
- 845 Walnut River Trail
- 1194 Pinnacle Dr
- 745 Walnut River Trail
- 330 Water Oak Trail
- 1021 Laurel Cove
- 1012 Laurel Cove
- 1020 Laurel Cove
- 501 Meadow Lake Terrace
- 411 Meadow Lake Terrace
- 410 Meadow Lake Terrace
- 531 Meadow Lake Terrace
- 931 Walnut Woods Dr
- 891 Walnut Woods Dr
- 1145 Glenwyck Dr
- 1030 Glenwyck Dr
- 691 Walnut Woods Dr
- 829 Walnut River Trail
- 829 Walnut River Trail
- 823 Walnut River Trail
- 835 Walnut River Trail
- 817 Walnut River Trail
- 832 Walnut River Trail Unit 11-12
- 832 Walnut River Trail
- 1185 Pinnacle #5c Dr
- 832 Walnut River #11-12 Trail
- 745 #2c Walnut River Trail
- 840 Walnut River Trail
- 850 Walnut River Trail
- 1111 Pinnacle Dr
- 856 Walnut River Trail
- 862 Walnut River Trail
- 838 Walnut River Trail
- 1188 Pinnacle Dr Unit LOT 8C
- 1188 Pinnacle Dr
- 1185 Pinnacle Dr Unit 5C
- 1185 Pinnacle Dr