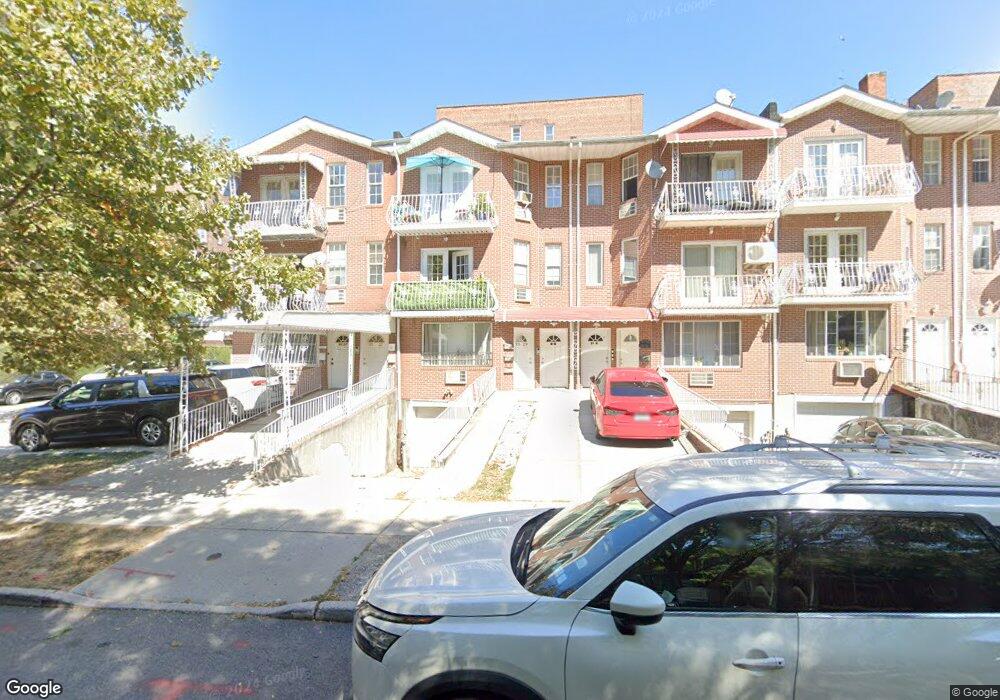
83-29 Talbot St Unit PHB10B Jamaica, NY 11415
Kew Gardens NeighborhoodEstimated Value: $1,610,000 - $2,297,000
--
Bed
--
Bath
3,540
Sq Ft
$560/Sq Ft
Est. Value
About This Home
This home is located at 83-29 Talbot St Unit PHB10B, Jamaica, NY 11415 and is currently estimated at $1,983,446, approximately $560 per square foot. 83-29 Talbot St Unit PHB10B is a home located in Queens County with nearby schools including P.S. 99 - Kew Gardens, J.H.S. 190 Russell Sage, and Hillcrest High School.
Ownership History
Date
Name
Owned For
Owner Type
Purchase Details
Closed on
Apr 10, 2003
Sold by
Rahman Mohammed M
Bought by
Malik Abdul and Malik Mahjabeen
Current Estimated Value
Purchase Details
Closed on
Nov 1, 2001
Sold by
Golani Llc
Bought by
Rahman Mohammed M
Purchase Details
Closed on
Mar 24, 2000
Sold by
Kahen Sharon
Bought by
Golani Llc
Purchase Details
Closed on
Jan 21, 2000
Sold by
Weingarten Fred
Bought by
Kahen Sharon
Home Financials for this Owner
Home Financials are based on the most recent Mortgage that was taken out on this home.
Original Mortgage
$300,000
Interest Rate
7.12%
Purchase Details
Closed on
Sep 19, 1997
Sold by
Ziffer Ronald and Ziffer Jeffrey
Bought by
Weingarten Fred
Home Financials for this Owner
Home Financials are based on the most recent Mortgage that was taken out on this home.
Original Mortgage
$243,750
Interest Rate
6.87%
Create a Home Valuation Report for This Property
The Home Valuation Report is an in-depth analysis detailing your home's value as well as a comparison with similar homes in the area
Home Values in the Area
Average Home Value in this Area
Purchase History
| Date | Buyer | Sale Price | Title Company |
|---|---|---|---|
| Malik Abdul | $815,000 | -- | |
| Rahman Mohammed M | -- | -- | |
| Golani Llc | -- | Commonwealth Land Title Ins | |
| Kahen Sharon | $462,000 | -- | |
| Weingarten Fred | $325,000 | -- |
Source: Public Records
Mortgage History
| Date | Status | Borrower | Loan Amount |
|---|---|---|---|
| Previous Owner | Kahen Sharon | $300,000 | |
| Previous Owner | Weingarten Fred | $243,750 | |
| Closed | Malik Abdul | $0 |
Source: Public Records
Tax History Compared to Growth
Tax History
| Year | Tax Paid | Tax Assessment Tax Assessment Total Assessment is a certain percentage of the fair market value that is determined by local assessors to be the total taxable value of land and additions on the property. | Land | Improvement |
|---|---|---|---|---|
| 2025 | $13,974 | $73,746 | $28,035 | $45,711 |
| 2024 | $13,974 | $69,572 | $25,764 | $43,808 |
| 2023 | $13,330 | $65,635 | $20,603 | $45,032 |
| 2022 | $12,361 | $86,640 | $32,640 | $54,000 |
| 2021 | $13,031 | $85,320 | $32,640 | $52,680 |
| 2020 | $13,008 | $80,820 | $32,640 | $48,180 |
| 2019 | $12,128 | $80,880 | $32,640 | $48,240 |
| 2018 | $11,150 | $54,696 | $31,354 | $23,342 |
| 2017 | $10,519 | $51,600 | $32,640 | $18,960 |
| 2016 | $10,783 | $51,600 | $32,640 | $18,960 |
| 2015 | $6,578 | $55,380 | $36,240 | $19,140 |
| 2014 | $6,578 | $54,123 | $33,946 | $20,177 |
Source: Public Records
Map
Nearby Homes
- 83-31 Talbot St
- 125-16 83rd Dr Unit 6H
- 83-52 Talbot St Unit 3-J
- 83-52 Talbot St Unit 5C
- 83-52 Talbot St Unit 2H
- 83-64 Talbot St Unit 3F
- 8364 Talbot St Unit 4B
- 83-74 Talbot St Unit 2-A
- 83-33 Austin St Unit 2N
- 83-33 Austin St Unit 6T
- 83-33 Austin St Unit 2C
- 83-00 Talbot St Unit 6F
- 83-40 Austin St Unit 4L
- 83-40 Austin St Unit 1T
- 81-26 Austin St
- 83-71 116 St Unit 4B
- 82-37 Austin St
- 123-40 83rd Ave Unit 6-D
- 123-40 83rd Ave Unit 2C
- 123-40 83rd Ave Unit 1A
- 83-29 Talbot St
- 8329 Talbot St
- 8331 Talbot St
- 83 Talbot St Unit PHB 10 B
- 8327 Talbot St
- 83-37 Talbot St Unit 1st Fl
- 83-35 Talbot St
- 8333 Talbot St
- 8335 Talbot St
- 8337 Talbot St
- 83-39 Talbot St
- 83-39 Talbot St Unit 2A
- 83-39 Talbot St Unit 2nd Fl
- 83-39 Talbot St Unit 3rd Fl
- 8339 Talbot St
- 12516 83rd Dr
- 12516 83rd Dr Unit SUPER
- 12516 83rd Dr Unit 1A
- 12516 83rd Dr Unit 5C
- 12516 83rd Dr Unit 3G