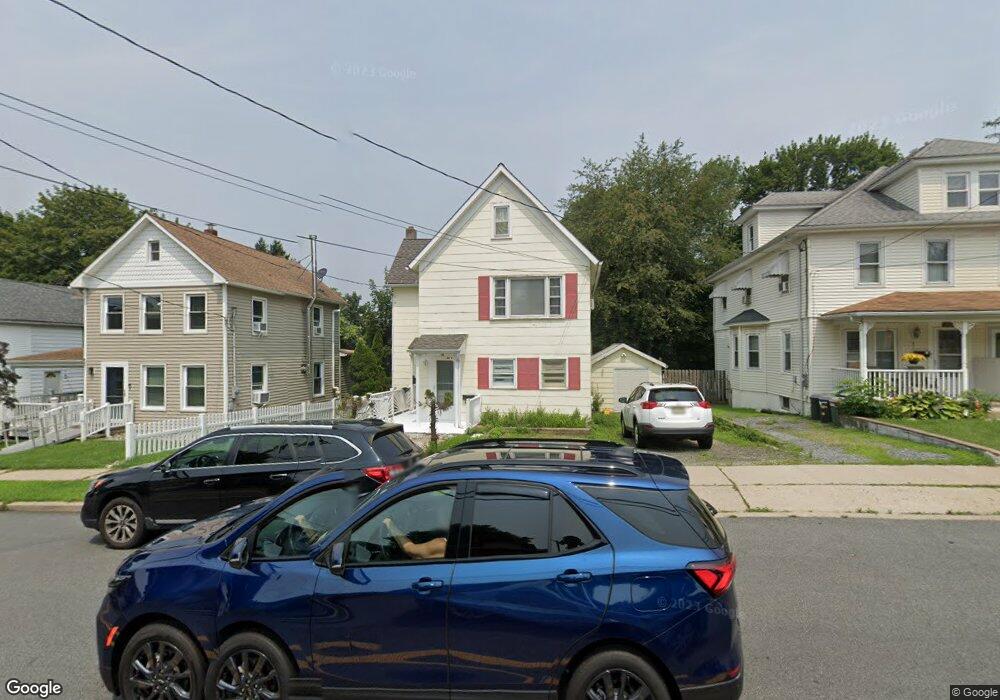
83 Allen St Netcong, NJ 07857
Estimated Value: $376,436 - $427,000
--
Bed
--
Bath
1,246
Sq Ft
$313/Sq Ft
Est. Value
About This Home
This home is located at 83 Allen St, Netcong, NJ 07857 and is currently estimated at $390,109, approximately $313 per square foot. 83 Allen St is a home located in Morris County with nearby schools including Netcong Elementary School and Lenape Val Regional High School.
Ownership History
Date
Name
Owned For
Owner Type
Purchase Details
Closed on
Sep 28, 2015
Sold by
Fannie Mae
Bought by
Hu Chun Hong
Current Estimated Value
Home Financials for this Owner
Home Financials are based on the most recent Mortgage that was taken out on this home.
Original Mortgage
$91,200
Outstanding Balance
$71,755
Interest Rate
3.88%
Mortgage Type
New Conventional
Estimated Equity
$318,354
Purchase Details
Closed on
Jul 2, 2014
Sold by
Dash Peter
Bought by
Federal National Mortgage Association
Purchase Details
Closed on
Apr 30, 2001
Sold by
Levitt Dave
Bought by
Dash Peter
Home Financials for this Owner
Home Financials are based on the most recent Mortgage that was taken out on this home.
Original Mortgage
$117,100
Interest Rate
7.03%
Mortgage Type
FHA
Create a Home Valuation Report for This Property
The Home Valuation Report is an in-depth analysis detailing your home's value as well as a comparison with similar homes in the area
Home Values in the Area
Average Home Value in this Area
Purchase History
| Date | Buyer | Sale Price | Title Company |
|---|---|---|---|
| Hu Chun Hong | $121,500 | Agent For Stewart Title Guar | |
| Federal National Mortgage Association | -- | None Available | |
| Dash Peter | $119,000 | -- |
Source: Public Records
Mortgage History
| Date | Status | Borrower | Loan Amount |
|---|---|---|---|
| Open | Hu Chun Hong | $91,200 | |
| Previous Owner | Dash Peter | $117,100 |
Source: Public Records
Tax History Compared to Growth
Tax History
| Year | Tax Paid | Tax Assessment Tax Assessment Total Assessment is a certain percentage of the fair market value that is determined by local assessors to be the total taxable value of land and additions on the property. | Land | Improvement |
|---|---|---|---|---|
| 2025 | $6,960 | $203,700 | $102,100 | $101,600 |
| 2024 | $7,022 | $203,700 | $102,100 | $101,600 |
| 2023 | $7,022 | $203,700 | $102,100 | $101,600 |
| 2022 | $6,362 | $203,700 | $102,100 | $101,600 |
| 2021 | $6,362 | $203,700 | $102,100 | $101,600 |
| 2020 | $5,075 | $165,000 | $121,000 | $44,000 |
| 2019 | $4,831 | $165,000 | $121,000 | $44,000 |
| 2018 | $4,542 | $165,000 | $121,000 | $44,000 |
| 2017 | $4,364 | $165,000 | $121,000 | $44,000 |
| 2016 | $5,810 | $225,800 | $138,900 | $86,900 |
| 2015 | $6,361 | $256,600 | $154,300 | $102,300 |
| 2014 | $6,084 | $256,600 | $154,300 | $102,300 |
Source: Public Records
Map
Nearby Homes