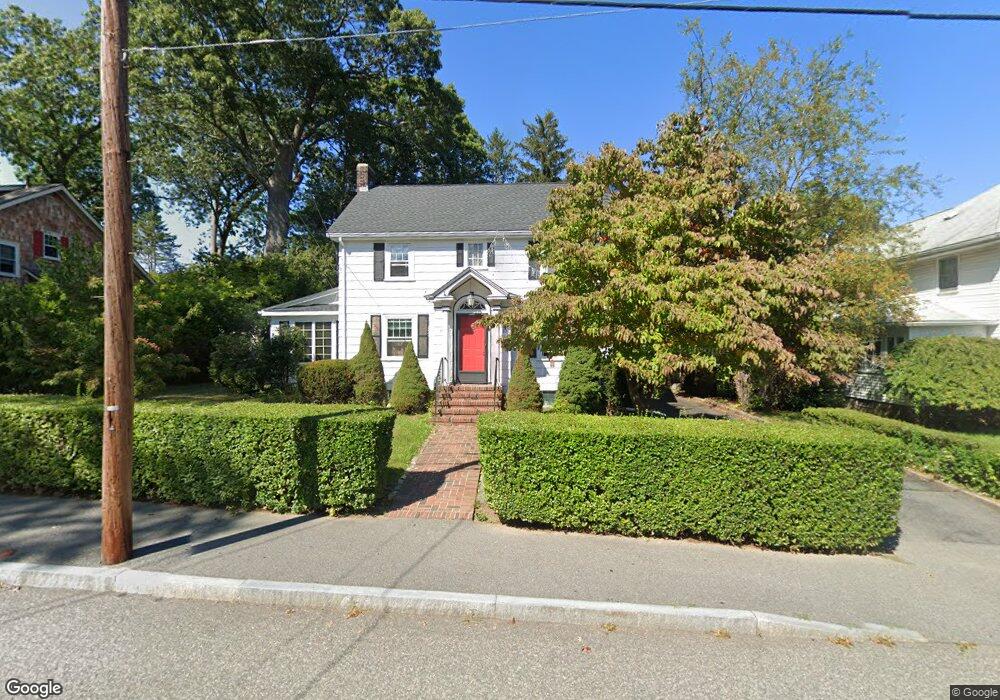
83 Brow Ave Braintree, MA 02184
North Braintree NeighborhoodEstimated Value: $702,000 - $845,000
3
Beds
1
Bath
1,589
Sq Ft
$482/Sq Ft
Est. Value
About This Home
This home is located at 83 Brow Ave, Braintree, MA 02184 and is currently estimated at $765,552, approximately $481 per square foot. 83 Brow Ave is a home located in Norfolk County with nearby schools including Braintree High School, Step Ahead Kindergarten, and Meeting House Montessori School.
Ownership History
Date
Name
Owned For
Owner Type
Purchase Details
Closed on
Nov 16, 2018
Sold by
Zheng Jing
Bought by
Z & J Property Managemen
Current Estimated Value
Purchase Details
Closed on
Oct 2, 1992
Sold by
Fleet Bk Of Ma Na
Bought by
Ellis Richard S and Ellis Mary P
Purchase Details
Closed on
Feb 4, 1992
Sold by
Est Snow Terrence
Bought by
Fleet Bk Of Mass N A
Create a Home Valuation Report for This Property
The Home Valuation Report is an in-depth analysis detailing your home's value as well as a comparison with similar homes in the area
Home Values in the Area
Average Home Value in this Area
Purchase History
| Date | Buyer | Sale Price | Title Company |
|---|---|---|---|
| Z & J Property Managemen | -- | -- | |
| Ellis Richard S | $162,000 | -- | |
| Fleet Bk Of Mass N A | $129,000 | -- | |
| Z & J Property Managemen | -- | -- | |
| Ellis Richard S | $162,000 | -- | |
| Fleet Bk Of Mass N A | $129,000 | -- |
Source: Public Records
Mortgage History
| Date | Status | Borrower | Loan Amount |
|---|---|---|---|
| Previous Owner | Fleet Bk Of Mass N A | $431,200 | |
| Previous Owner | Fleet Bk Of Mass N A | $235,000 |
Source: Public Records
Tax History
| Year | Tax Paid | Tax Assessment Tax Assessment Total Assessment is a certain percentage of the fair market value that is determined by local assessors to be the total taxable value of land and additions on the property. | Land | Improvement |
|---|---|---|---|---|
| 2025 | $7,109 | $712,300 | $393,600 | $318,700 |
| 2024 | $6,381 | $673,100 | $369,000 | $304,100 |
| 2023 | $6,070 | $621,900 | $334,600 | $287,300 |
| 2022 | $5,796 | $582,500 | $295,200 | $287,300 |
| 2021 | $5,630 | $565,800 | $295,200 | $270,600 |
| 2020 | $5,230 | $530,400 | $259,800 | $270,600 |
| 2019 | $4,784 | $474,100 | $259,800 | $214,300 |
| 2018 | $4,447 | $421,900 | $216,500 | $205,400 |
| 2017 | $4,437 | $413,100 | $216,500 | $196,600 |
| 2016 | $4,190 | $381,600 | $196,800 | $184,800 |
| 2015 | $4,109 | $371,200 | $193,800 | $177,400 |
| 2014 | $3,885 | $340,200 | $176,100 | $164,100 |
Source: Public Records
Map
Nearby Homes
- 5 Woodsum Dr Unit 12
- 491 Washington St Unit 1
- 469-471 Washington St
- 87 Walnut St
- 6 Franklin St
- 18 Royal Lake Dr Unit 3
- 7 Del's Way
- 15 Calvin St
- 50 Cleveland Ave
- 63 Dickerman Ln
- 36 Chestnut Ave
- 20 Vine St
- 145 Hancock St Unit 307
- 145 Hancock St Unit 201
- 29 Joseph Rd
- 47 Addison St
- 29 Saint Michael Rd
- 418 John Mahar Hwy Unit 408
- 44 Shepard Rd
- 20 Blossom Rd
Your Personal Tour Guide
Ask me questions while you tour the home.