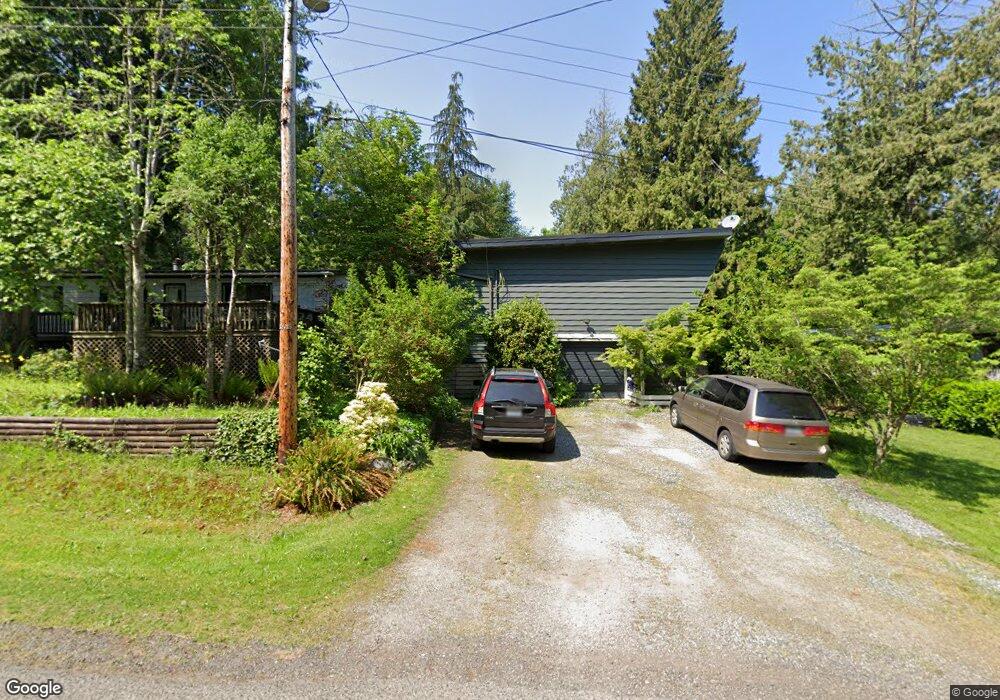
83 Calgary Way Point Roberts, WA 98281
Estimated Value: $408,000 - $494,000
2
Beds
3
Baths
1,273
Sq Ft
$359/Sq Ft
Est. Value
About This Home
This home is located at 83 Calgary Way, Point Roberts, WA 98281 and is currently estimated at $456,726, approximately $358 per square foot. 83 Calgary Way is a home located in Whatcom County with nearby schools including Point Roberts Primary School, Blaine Middle School, and Blaine High School.
Ownership History
Date
Name
Owned For
Owner Type
Purchase Details
Closed on
Nov 30, 2012
Sold by
Williams Gregory Kean and Williams Kelly Ann
Bought by
Williams Gregory Kean and Williams Kelly Ann
Current Estimated Value
Home Financials for this Owner
Home Financials are based on the most recent Mortgage that was taken out on this home.
Original Mortgage
$161,000
Outstanding Balance
$111,020
Interest Rate
3.27%
Mortgage Type
New Conventional
Estimated Equity
$345,706
Purchase Details
Closed on
Sep 18, 2003
Sold by
Lyne Richard L and Lyne Kelly D
Bought by
Williams Gregory Keen and Williams Kelly Ann
Home Financials for this Owner
Home Financials are based on the most recent Mortgage that was taken out on this home.
Original Mortgage
$160,236
Interest Rate
6.17%
Mortgage Type
FHA
Create a Home Valuation Report for This Property
The Home Valuation Report is an in-depth analysis detailing your home's value as well as a comparison with similar homes in the area
Home Values in the Area
Average Home Value in this Area
Purchase History
| Date | Buyer | Sale Price | Title Company |
|---|---|---|---|
| Williams Gregory Kean | -- | Lsi North | |
| Williams Gregory Keen | -- | Whatcom Land Title |
Source: Public Records
Mortgage History
| Date | Status | Borrower | Loan Amount |
|---|---|---|---|
| Open | Williams Gregory Kean | $161,000 | |
| Closed | Williams Gregory Keen | $160,236 |
Source: Public Records
Tax History Compared to Growth
Tax History
| Year | Tax Paid | Tax Assessment Tax Assessment Total Assessment is a certain percentage of the fair market value that is determined by local assessors to be the total taxable value of land and additions on the property. | Land | Improvement |
|---|---|---|---|---|
| 2024 | $3,141 | $388,754 | $102,383 | $286,371 |
| 2023 | $3,141 | $379,446 | $93,075 | $286,371 |
| 2022 | $2,604 | $346,526 | $85,000 | $261,526 |
| 2021 | $2,593 | $259,789 | $53,504 | $206,285 |
| 2020 | $2,582 | $240,541 | $49,540 | $191,001 |
| 2019 | $2,395 | $230,733 | $47,520 | $183,213 |
| 2018 | $2,283 | $207,427 | $42,720 | $164,707 |
| 2017 | $1,979 | $198,104 | $40,800 | $157,304 |
| 2016 | $1,997 | $194,220 | $40,000 | $154,220 |
| 2015 | $2,124 | $190,541 | $38,644 | $151,897 |
| 2014 | -- | $199,195 | $40,400 | $158,795 |
| 2013 | -- | $190,334 | $38,800 | $151,534 |
Source: Public Records
Map
Nearby Homes
- 1931 Sanders Ct Unit 11
- 1852 Washington Dr
- 1871 Johnson Rd
- 25 Roosevelt Way
- 2 Mill Rd
- 308 Mill Rd
- 1 Mill Rd
- 0 3 73 Acres Derby Ave
- 125 Park Dr
- 157 Northwood Dr
- 103 Goodman Rd
- 2132 Maple St
- 323 Evergreen Way
- 2145 Fir St
- 8 Heather Way
- 17 Lot Massey Way
- 2136 Culp Ct
- 2 Benson Rd
- 215 Bay View Dr
- 1521 Roosevelt Way
- 75 Calgary Way
- 92 Victoria Way
- 65 Calgary Way
- 97 Calgary Way
- 0 Kennedy Rd
- 76 Calgary Way
- 1886 Province Rd
- 70 Victoria Way
- 1860 Province Rd
- 1881 Cliff Rd
- 1893 Cliff Rd
- 0 Victoria Way
- 1897 Cliff Rd
- 145 Victoria Way
- 1894 Province Rd
- 95 Victoria Way
- 1882 Cliff Rd
- 161 Ronald Dr
- 161 Ronald Dr
- 1888 Cliff Rd