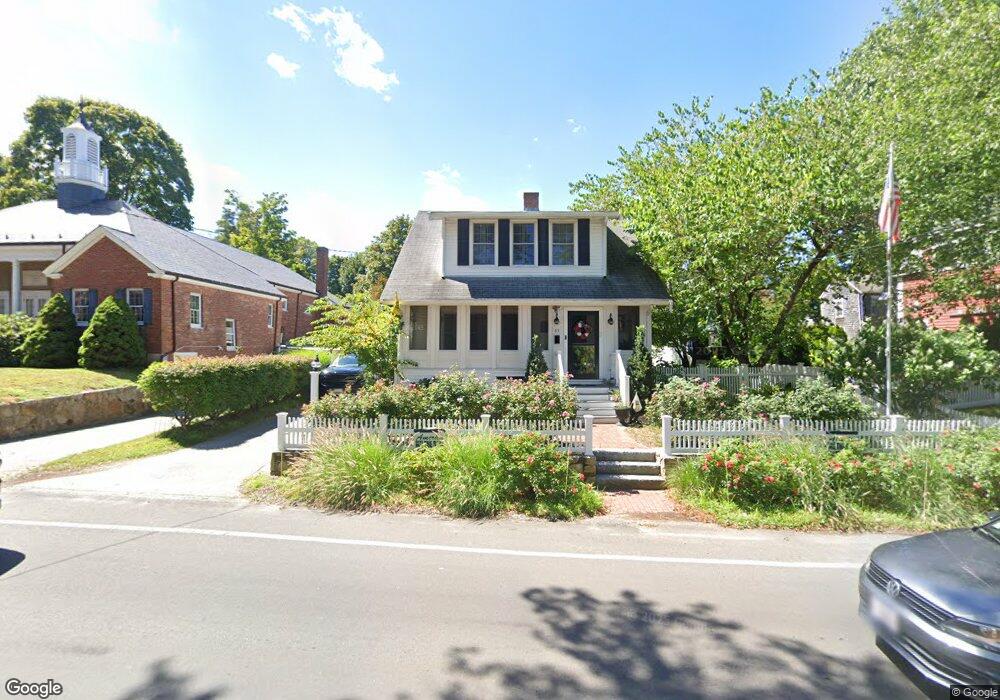
83 Central St Hingham, MA 02043
Estimated Value: $816,000 - $1,263,000
3
Beds
1
Bath
1,772
Sq Ft
$617/Sq Ft
Est. Value
About This Home
This home is located at 83 Central St, Hingham, MA 02043 and is currently estimated at $1,093,312, approximately $616 per square foot. 83 Central St is a home located in Plymouth County with nearby schools including William L. Foster Elementary School, Hingham Middle School, and Hingham High School.
Ownership History
Date
Name
Owned For
Owner Type
Purchase Details
Closed on
Oct 21, 2024
Sold by
Love Central T and Love
Bought by
Dennis & Erin Love Lt and Love
Current Estimated Value
Purchase Details
Closed on
Aug 27, 2020
Sold by
Waite Philip A and Waite Carole A
Bought by
Love Central T and Love
Purchase Details
Closed on
May 29, 1987
Sold by
Carlson Steven D
Bought by
Waite Philip A
Create a Home Valuation Report for This Property
The Home Valuation Report is an in-depth analysis detailing your home's value as well as a comparison with similar homes in the area
Purchase History
| Date | Buyer | Sale Price | Title Company |
|---|---|---|---|
| Dennis & Erin Love Lt | -- | None Available | |
| Dennis & Erin Love Lt | -- | None Available | |
| Love Central T | -- | None Available | |
| Love Central T | -- | None Available | |
| Waite Philip A | $208,000 | -- |
Source: Public Records
Mortgage History
| Date | Status | Borrower | Loan Amount |
|---|---|---|---|
| Previous Owner | Waite Philip A | $361,700 | |
| Previous Owner | Waite Philip A | $370,000 | |
| Previous Owner | Waite Philip A | $232,100 |
Source: Public Records
Tax History
| Year | Tax Paid | Tax Assessment Tax Assessment Total Assessment is a certain percentage of the fair market value that is determined by local assessors to be the total taxable value of land and additions on the property. | Land | Improvement |
|---|---|---|---|---|
| 2025 | $9,697 | $907,100 | $475,300 | $431,800 |
| 2024 | $8,845 | $815,200 | $475,300 | $339,900 |
| 2023 | $7,992 | $799,200 | $475,300 | $323,900 |
| 2022 | $8,256 | $714,200 | $396,100 | $318,100 |
| 2021 | $8,268 | $700,700 | $412,600 | $288,100 |
| 2020 | $8,079 | $700,700 | $412,600 | $288,100 |
| 2019 | $8,059 | $682,400 | $412,600 | $269,800 |
| 2018 | $12,190 | $672,200 | $412,600 | $259,600 |
| 2017 | $7,389 | $603,200 | $379,100 | $224,100 |
| 2016 | $7,262 | $581,400 | $361,000 | $220,400 |
| 2015 | $6,952 | $554,800 | $343,800 | $211,000 |
Source: Public Records
Map
Nearby Homes
Your Personal Tour Guide
Ask me questions while you tour the home.