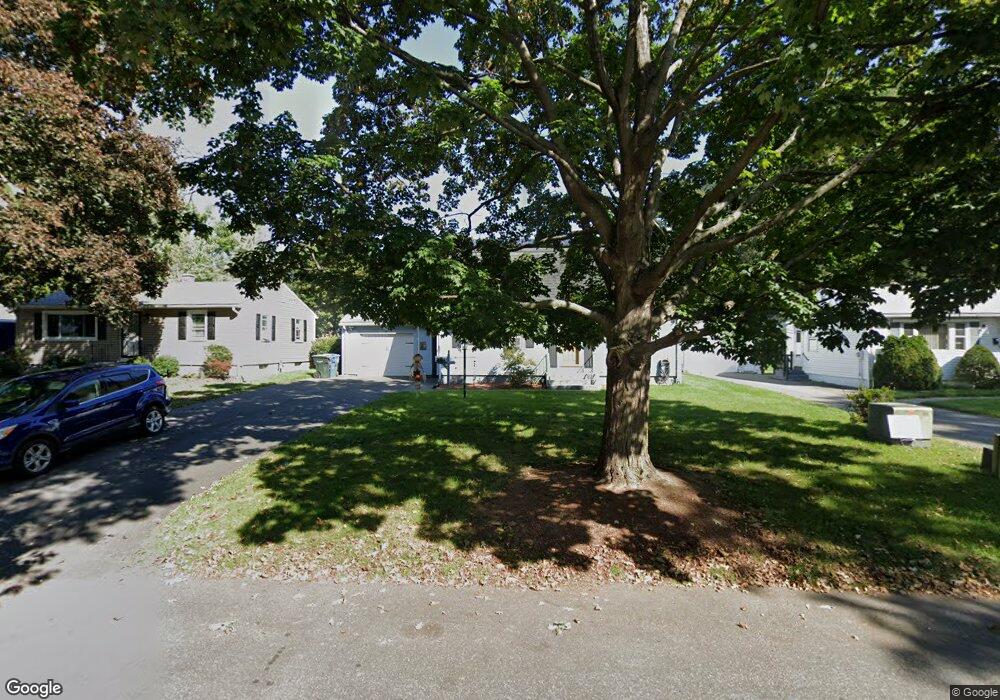
83 Clement St Springfield, MA 01118
East Forest Park NeighborhoodEstimated Value: $325,381 - $352,000
4
Beds
2
Baths
1,536
Sq Ft
$220/Sq Ft
Est. Value
About This Home
This home is located at 83 Clement St, Springfield, MA 01118 and is currently estimated at $338,595, approximately $220 per square foot. 83 Clement St is a home located in Hampden County with nearby schools including Frederick Harris Elementary School, M Marcus Kiley Middle, and Springfield High School of Science and Technology.
Ownership History
Date
Name
Owned For
Owner Type
Purchase Details
Closed on
Oct 31, 2003
Sold by
Beauvais Gregoire and Reavey Jacqueline B
Bought by
Shaw Allen P and Shaw Susan F
Current Estimated Value
Home Financials for this Owner
Home Financials are based on the most recent Mortgage that was taken out on this home.
Original Mortgage
$158,517
Outstanding Balance
$73,744
Interest Rate
6.05%
Mortgage Type
Purchase Money Mortgage
Estimated Equity
$264,851
Purchase Details
Closed on
Apr 14, 1992
Sold by
Griffin John P and Griffin Mary J
Bought by
Beauvais R Lois
Home Financials for this Owner
Home Financials are based on the most recent Mortgage that was taken out on this home.
Original Mortgage
$91,200
Interest Rate
8.73%
Mortgage Type
Purchase Money Mortgage
Create a Home Valuation Report for This Property
The Home Valuation Report is an in-depth analysis detailing your home's value as well as a comparison with similar homes in the area
Home Values in the Area
Average Home Value in this Area
Purchase History
| Date | Buyer | Sale Price | Title Company |
|---|---|---|---|
| Shaw Allen P | $154,900 | -- | |
| Beauvais R Lois | $91,200 | -- |
Source: Public Records
Mortgage History
| Date | Status | Borrower | Loan Amount |
|---|---|---|---|
| Open | Shaw Allen P | $158,517 | |
| Previous Owner | Beauvais R Lois | $50,200 | |
| Previous Owner | Beauvais R Lois | $91,200 | |
| Previous Owner | Beauvais R Lois | $91,500 |
Source: Public Records
Tax History
| Year | Tax Paid | Tax Assessment Tax Assessment Total Assessment is a certain percentage of the fair market value that is determined by local assessors to be the total taxable value of land and additions on the property. | Land | Improvement |
|---|---|---|---|---|
| 2025 | $4,278 | $272,800 | $39,000 | $233,800 |
| 2024 | $3,829 | $238,400 | $39,000 | $199,400 |
| 2023 | $3,826 | $224,400 | $40,500 | $183,900 |
| 2022 | $3,756 | $199,600 | $40,500 | $159,100 |
| 2021 | $3,379 | $178,800 | $36,800 | $142,000 |
| 2020 | $3,369 | $172,500 | $36,800 | $135,700 |
| 2019 | $3,198 | $162,500 | $36,800 | $125,700 |
| 2018 | $3,371 | $171,300 | $36,800 | $134,500 |
| 2017 | $3,234 | $164,500 | $36,800 | $127,700 |
| 2016 | $3,136 | $159,500 | $36,800 | $122,700 |
| 2015 | $3,006 | $152,800 | $36,800 | $116,000 |
Source: Public Records
Map
Nearby Homes
- 47 Hartford Terrace
- 7 Ashbrook St
- 79 Roosevelt Ave
- 509 Plumtree Rd
- 75 Gillette Cir
- 1088 Sumner Ave
- 134 Eddywood St
- 29 Eddywood St
- 19 Manor Ct Unit 19
- 37 Chesterfield Ave
- 101 Regal St
- 13 Bither St
- 170 Plumtree Rd
- 119 Powell Ave
- 125 Manor Ct Unit 125
- 384 Abbott St
- 647 Plumtree Rd
- 55 Allen St
- 34 Castle St
- 118 Pilgrim Rd
Your Personal Tour Guide
Ask me questions while you tour the home.