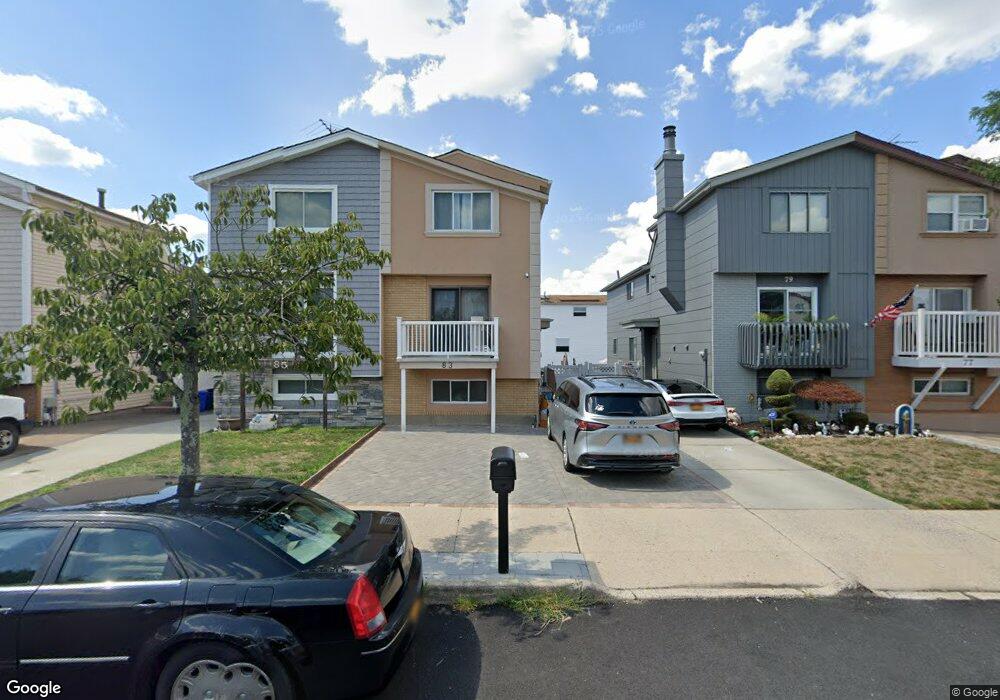
83 Denker Place Staten Island, NY 10314
New Springville NeighborhoodEstimated Value: $718,000 - $782,000
3
Beds
2
Baths
2,352
Sq Ft
$317/Sq Ft
Est. Value
About This Home
This home is located at 83 Denker Place, Staten Island, NY 10314 and is currently estimated at $745,406, approximately $316 per square foot. 83 Denker Place is a home located in Richmond County with nearby schools including P.S. 69 - Daniel D. Tompkins, Is 72 Rocco Laurie, and Port Richmond High School.
Ownership History
Date
Name
Owned For
Owner Type
Purchase Details
Closed on
Aug 27, 2016
Sold by
Lee See May Angel and Lee Micky
Bought by
Lee Micky and Zou Lin
Current Estimated Value
Home Financials for this Owner
Home Financials are based on the most recent Mortgage that was taken out on this home.
Original Mortgage
$320,000
Outstanding Balance
$255,850
Interest Rate
3.46%
Mortgage Type
New Conventional
Estimated Equity
$489,556
Purchase Details
Closed on
Jun 27, 2012
Sold by
Jacobs Matthew A and Jacobs Chantra D
Bought by
Lee See May Angel and Lee Micky
Home Financials for this Owner
Home Financials are based on the most recent Mortgage that was taken out on this home.
Original Mortgage
$333,000
Interest Rate
3.7%
Mortgage Type
New Conventional
Purchase Details
Closed on
Jul 27, 2007
Sold by
Jacobs Bruce and Jacobs Elaine
Bought by
Jacobs Matthew A and Jacobs Chantra D
Home Financials for this Owner
Home Financials are based on the most recent Mortgage that was taken out on this home.
Original Mortgage
$220,000
Interest Rate
6.74%
Mortgage Type
Purchase Money Mortgage
Create a Home Valuation Report for This Property
The Home Valuation Report is an in-depth analysis detailing your home's value as well as a comparison with similar homes in the area
Home Values in the Area
Average Home Value in this Area
Purchase History
| Date | Buyer | Sale Price | Title Company |
|---|---|---|---|
| Lee Micky | -- | The Security Title Guarantee | |
| Lee See May Angel | $370,000 | First American Title Ins Co | |
| Jacobs Matthew A | $420,000 | None Available |
Source: Public Records
Mortgage History
| Date | Status | Borrower | Loan Amount |
|---|---|---|---|
| Open | Lee Micky | $320,000 | |
| Closed | Lee See May Angel | $333,000 | |
| Previous Owner | Jacobs Matthew A | $220,000 |
Source: Public Records
Tax History Compared to Growth
Tax History
| Year | Tax Paid | Tax Assessment Tax Assessment Total Assessment is a certain percentage of the fair market value that is determined by local assessors to be the total taxable value of land and additions on the property. | Land | Improvement |
|---|---|---|---|---|
| 2025 | $6,438 | $41,880 | $6,085 | $35,795 |
| 2024 | $6,438 | $36,540 | $6,579 | $29,961 |
| 2023 | $6,510 | $32,054 | $5,565 | $26,489 |
| 2022 | $6,281 | $37,560 | $7,500 | $30,060 |
| 2021 | $6,316 | $38,340 | $7,500 | $30,840 |
| 2020 | $5,993 | $36,600 | $7,500 | $29,100 |
| 2019 | $5,588 | $33,900 | $7,500 | $26,400 |
| 2018 | $5,445 | $26,712 | $5,688 | $21,024 |
| 2017 | $5,345 | $26,220 | $7,500 | $18,720 |
| 2016 | $5,000 | $25,010 | $7,408 | $17,602 |
| 2015 | $4,272 | $23,595 | $6,228 | $17,367 |
| 2014 | $4,272 | $22,260 | $6,240 | $16,020 |
Source: Public Records
Map
Nearby Homes
- 107 Denker Place
- 343 Travis Ave
- 101 McVeigh Ave
- 181 McVeigh Ave
- 611 Klondike Ave
- 190 Monahan Ave
- 186 Monahan Ave
- 507 Klondike Ave
- 60 Copley St
- 44 McVeigh Ave
- 187 Keating Place
- 45 Braisted Ave
- 143 Monahan Ave
- 11 Shirra Ave Unit A
- 22 Braisted Ave
- 20 Sweetgum Ln
- 28A Mcdivitt Ave Unit 11
- 8 Mcdivitt Ave Unit A
- 86 Evans St
- 127 Keating Place
- 79 Denker Place
- 85 Denker Place
- 89 Denker Place
- 77 Denker Place
- 142 McVeigh Ave
- 91 Denker Place
- 144 McVeigh Ave
- 95 Denker Place
- 375 Travis Ave
- 148 McVeigh Ave
- 97 Denker Place
- 377 Travis Ave
- 122 McVeigh Ave
- 71 Denker Place
- 150 McVeigh Ave
- 381 Travis Ave
- 120 McVeigh Ave
- 357 Travis Ave
- 69 Denker Place
- 154 McVeigh Ave