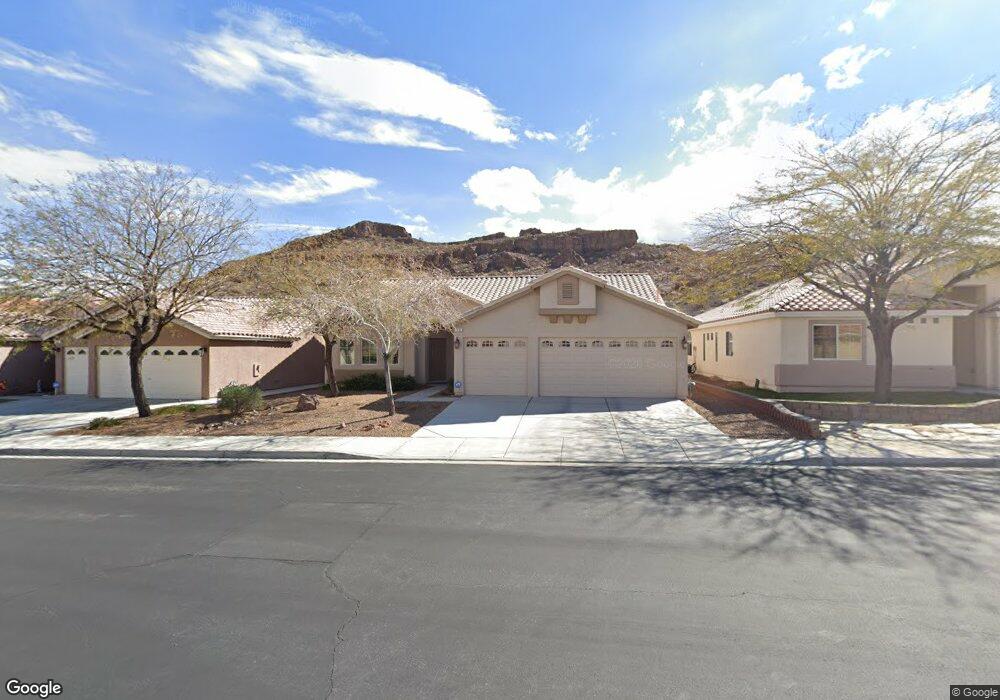
83 Desert Sunflower Cir Henderson, NV 89002
Estimated Value: $537,369 - $612,000
4
Beds
2
Baths
2,119
Sq Ft
$273/Sq Ft
Est. Value
About This Home
This home is located at 83 Desert Sunflower Cir, Henderson, NV 89002 and is currently estimated at $578,592, approximately $273 per square foot. 83 Desert Sunflower Cir is a home located in Clark County with nearby schools including James E & A Rae Smalley Elementary School, Jack & Terry Mannion Middle School, and Foothill High School.
Ownership History
Date
Name
Owned For
Owner Type
Purchase Details
Closed on
May 15, 2024
Sold by
Phyllis A Moore Revocable Trust and Moore Phyllis A
Bought by
Moore Jeffrey A and Moore Phyllis A
Current Estimated Value
Purchase Details
Closed on
Dec 17, 2008
Sold by
Countrywide Home Loans Inc
Bought by
Phyllis A Moore Revocable Trust
Purchase Details
Closed on
Oct 25, 2008
Sold by
Klein Paul
Bought by
Countrywide Home Loans Inc and Deutschebank Harborview 04-11
Purchase Details
Closed on
Oct 5, 2004
Sold by
D R Horton Inc
Bought by
Klein Paul R
Home Financials for this Owner
Home Financials are based on the most recent Mortgage that was taken out on this home.
Original Mortgage
$399,239
Interest Rate
2.12%
Create a Home Valuation Report for This Property
The Home Valuation Report is an in-depth analysis detailing your home's value as well as a comparison with similar homes in the area
Home Values in the Area
Average Home Value in this Area
Purchase History
| Date | Buyer | Sale Price | Title Company |
|---|---|---|---|
| Moore Jeffrey A | -- | None Listed On Document | |
| Phyllis A Moore Revocable Trust | $267,000 | First American Title Paseo V | |
| Countrywide Home Loans Inc | $196,875 | First American Title Co | |
| Klein Paul R | $499,049 | Chicago Title |
Source: Public Records
Mortgage History
| Date | Status | Borrower | Loan Amount |
|---|---|---|---|
| Previous Owner | Klein Paul R | $399,239 | |
| Closed | Klein Paul R | $49,904 |
Source: Public Records
Tax History Compared to Growth
Tax History
| Year | Tax Paid | Tax Assessment Tax Assessment Total Assessment is a certain percentage of the fair market value that is determined by local assessors to be the total taxable value of land and additions on the property. | Land | Improvement |
|---|---|---|---|---|
| 2025 | $2,472 | $136,260 | $37,100 | $99,160 |
| 2024 | $2,401 | $136,260 | $37,100 | $99,160 |
| 2023 | $2,401 | $136,748 | $43,400 | $93,348 |
| 2022 | $2,331 | $122,026 | $36,750 | $85,276 |
| 2021 | $2,263 | $115,314 | $34,300 | $81,014 |
| 2020 | $2,194 | $111,634 | $31,500 | $80,134 |
| 2019 | $2,130 | $105,727 | $26,950 | $78,777 |
| 2018 | $2,068 | $99,259 | $23,450 | $75,809 |
| 2017 | $2,825 | $97,441 | $20,650 | $76,791 |
| 2016 | $1,959 | $81,586 | $15,750 | $65,836 |
| 2015 | $1,955 | $70,535 | $14,000 | $56,535 |
| 2014 | $1,897 | $63,553 | $10,500 | $53,053 |
Source: Public Records
Map
Nearby Homes
- 87 Rattlesnake Grass Ct
- 1044 Spanish Needle St
- 0 N San Gregorio Cir
- 1051 Upper Springs St
- 113 Lovage St
- 1034 Copper Palm Ct
- 0 E Mission Dr
- 43 Pangloss St
- 1014 Pleasing Plateau St
- 774 Wigan Pier Dr
- 787 Craigmark Ct
- 780 Vortex Ave
- 767 Wigan Pier Dr Unit 5
- 744 Fortacre St
- 181 Ridge Crossing Ave
- 70 Blaven Dr Unit 5
- 837 Holly Lake Way
- 107 Mint Orchard Dr
- 132 Westin Ln
- 645 Monument Point St
- 87 Desert Sunflower Cir
- 79 Desert Sunflower Cir
- 75 Desert Sunflower Cir
- 86 Desert Sunflower Cir
- 82 Desert Sunflower Cir
- 90 Desert Sunflower Cir
- 78 Desert Sunflower Cir
- 94 Desert Sunflower Cir
- 74 Desert Sunflower Cir
- 98 Desert Sunflower Cir
- 83 Rattlesnake Grass Ct
- 70 Desert Sunflower Cir
- 91 Rattlesnake Grass Ct
- 79 Rattlesnake Grass Ct
- 95 Rattlesnake Grass Ct
- 75 Rattlesnake Grass Ct
- 99 Rattlesnake Grass Ct
- 71 Rattlesnake Grass Ct
- 66 Desert Sunflower Cir
- 67 Rattlesnake Grass Ct