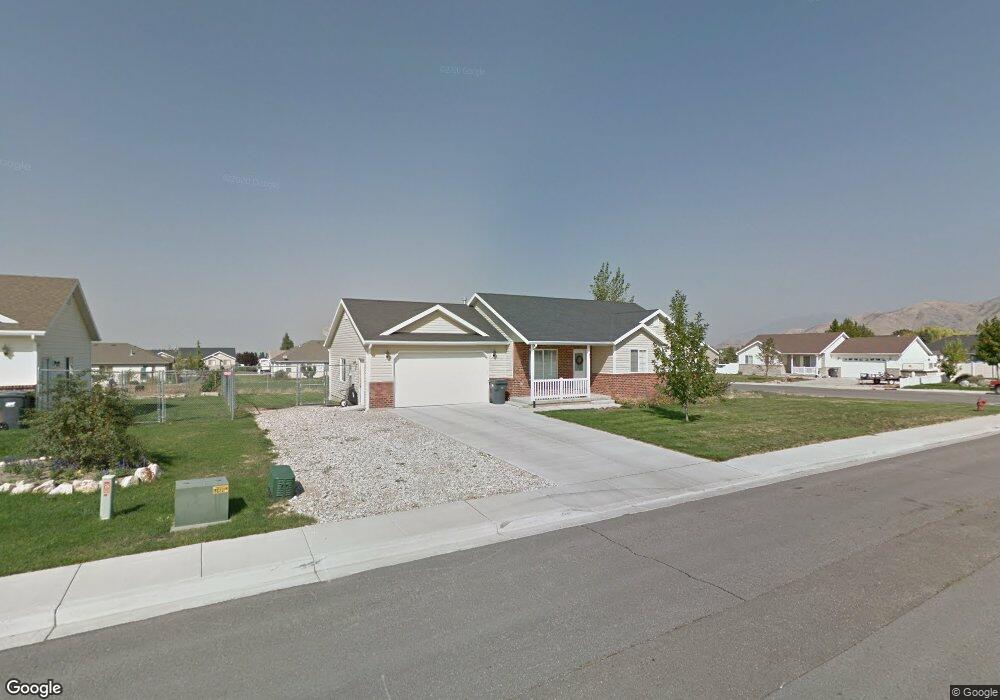
83 E 660 N Santaquin, UT 84655
Estimated Value: $484,992 - $502,000
3
Beds
3
Baths
1,195
Sq Ft
$414/Sq Ft
Est. Value
About This Home
This home is located at 83 E 660 N, Santaquin, UT 84655 and is currently estimated at $494,997, approximately $414 per square foot. 83 E 660 N is a home located in Utah County with nearby schools including Apple Valley Elementary, Payson Junior High School, and Mt. Nebo Middle.
Ownership History
Date
Name
Owned For
Owner Type
Purchase Details
Closed on
May 6, 2004
Sold by
Bastian Homes Inc
Bought by
Choules Wade and Choules Emily
Current Estimated Value
Home Financials for this Owner
Home Financials are based on the most recent Mortgage that was taken out on this home.
Original Mortgage
$138,329
Outstanding Balance
$64,309
Interest Rate
5.38%
Mortgage Type
FHA
Estimated Equity
$430,688
Purchase Details
Closed on
Apr 4, 2003
Sold by
Nac Co Llc
Bought by
Bastian Homes Inc
Create a Home Valuation Report for This Property
The Home Valuation Report is an in-depth analysis detailing your home's value as well as a comparison with similar homes in the area
Home Values in the Area
Average Home Value in this Area
Purchase History
| Date | Buyer | Sale Price | Title Company |
|---|---|---|---|
| Choules Wade | -- | Wasatch Land & Title | |
| Bastian Homes Inc | -- | Wasatch Land & Title |
Source: Public Records
Mortgage History
| Date | Status | Borrower | Loan Amount |
|---|---|---|---|
| Open | Choules Wade | $138,329 |
Source: Public Records
Tax History
| Year | Tax Paid | Tax Assessment Tax Assessment Total Assessment is a certain percentage of the fair market value that is determined by local assessors to be the total taxable value of land and additions on the property. | Land | Improvement |
|---|---|---|---|---|
| 2025 | $2,293 | $255,310 | -- | -- |
| 2024 | $2,366 | $228,360 | $0 | $0 |
| 2023 | $2,366 | $236,390 | $0 | $0 |
| 2022 | $2,436 | $250,965 | $0 | $0 |
| 2021 | $2,089 | $333,700 | $84,400 | $249,300 |
| 2020 | $2,008 | $310,800 | $73,400 | $237,400 |
| 2019 | $1,792 | $283,600 | $73,400 | $210,200 |
| 2018 | $1,679 | $253,400 | $64,100 | $189,300 |
| 2017 | $1,598 | $128,865 | $0 | $0 |
| 2016 | $1,507 | $119,075 | $0 | $0 |
| 2015 | $1,380 | $106,975 | $0 | $0 |
| 2014 | $1,258 | $97,295 | $0 | $0 |
Source: Public Records
Map
Nearby Homes
- 600 N Center St
- 41 W 770 N
- 152 E 840 N Unit 16
- 112 W 770 N
- 842 N 160 E
- 842 N 160 E Unit 17
- 873 N 200 E Unit 36
- 169 W 690 N
- 902 N 160 E
- 902 N 160 E Unit 19
- 923 N 200 E Unit 33
- 933 N 200 E
- 933 N 200 E Unit 32
- 42 E 400 N
- 186 W Royal Land Dr
- 225 W 500 North St
- 144 E 990 N
- 969 N Apple Seed Ln
- 109 W 930 N
- 949 N 215 W
Your Personal Tour Guide
Ask me questions while you tour the home.