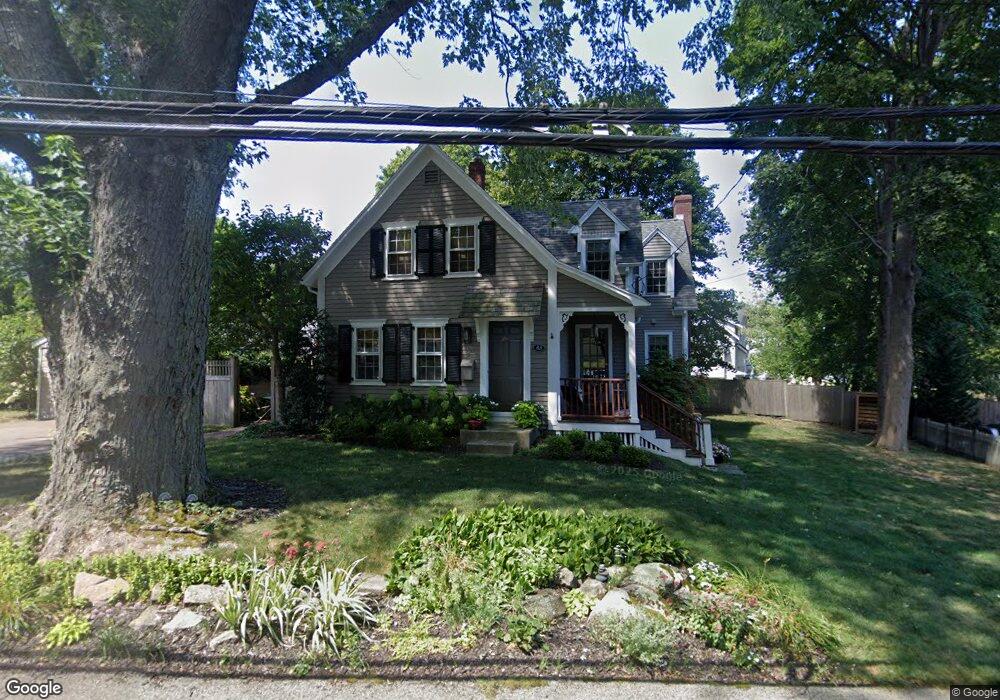
83 Elm St Hingham, MA 02043
Estimated Value: $1,188,856 - $1,447,000
3
Beds
2
Baths
2,175
Sq Ft
$631/Sq Ft
Est. Value
About This Home
This home is located at 83 Elm St, Hingham, MA 02043 and is currently estimated at $1,371,714, approximately $630 per square foot. 83 Elm St is a home located in Plymouth County with nearby schools including William L. Foster Elementary School, Hingham Middle School, and Hingham High School.
Ownership History
Date
Name
Owned For
Owner Type
Purchase Details
Closed on
Feb 1, 2007
Sold by
Bardsley Jennifer H
Bought by
Bardsley Laurence P and Bardsley Jennifer H
Current Estimated Value
Home Financials for this Owner
Home Financials are based on the most recent Mortgage that was taken out on this home.
Original Mortgage
$139,250
Outstanding Balance
$83,405
Interest Rate
6.16%
Mortgage Type
Purchase Money Mortgage
Estimated Equity
$1,288,309
Purchase Details
Closed on
May 21, 1987
Sold by
Hosea Irwin
Bought by
Bardsley Lawrence P
Create a Home Valuation Report for This Property
The Home Valuation Report is an in-depth analysis detailing your home's value as well as a comparison with similar homes in the area
Purchase History
| Date | Buyer | Sale Price | Title Company |
|---|---|---|---|
| Bardsley Laurence P | -- | -- | |
| Bardsley Jennifer H | -- | -- | |
| Bardsley Lawrence P | $170,000 | -- |
Source: Public Records
Mortgage History
| Date | Status | Borrower | Loan Amount |
|---|---|---|---|
| Open | Bardsley Lawrence P | $139,250 | |
| Closed | Bardsley Lawrence P | $139,250 |
Source: Public Records
Tax History
| Year | Tax Paid | Tax Assessment Tax Assessment Total Assessment is a certain percentage of the fair market value that is determined by local assessors to be the total taxable value of land and additions on the property. | Land | Improvement |
|---|---|---|---|---|
| 2025 | $11,573 | $1,082,600 | $647,600 | $435,000 |
| 2024 | $10,766 | $992,300 | $647,600 | $344,700 |
| 2023 | $9,759 | $975,900 | $647,600 | $328,300 |
| 2022 | $10,183 | $880,900 | $558,300 | $322,600 |
| 2021 | $6,656 | $842,300 | $558,300 | $284,000 |
| 2020 | $7,075 | $842,300 | $558,300 | $284,000 |
| 2019 | $8,599 | $728,100 | $465,300 | $262,800 |
| 2018 | $9,076 | $718,000 | $465,300 | $252,700 |
| 2017 | $8,096 | $660,900 | $442,900 | $218,000 |
| 2016 | $7,947 | $636,300 | $421,900 | $214,400 |
| 2015 | $7,604 | $606,900 | $401,800 | $205,100 |
Source: Public Records
Map
Nearby Homes
Your Personal Tour Guide
Ask me questions while you tour the home.