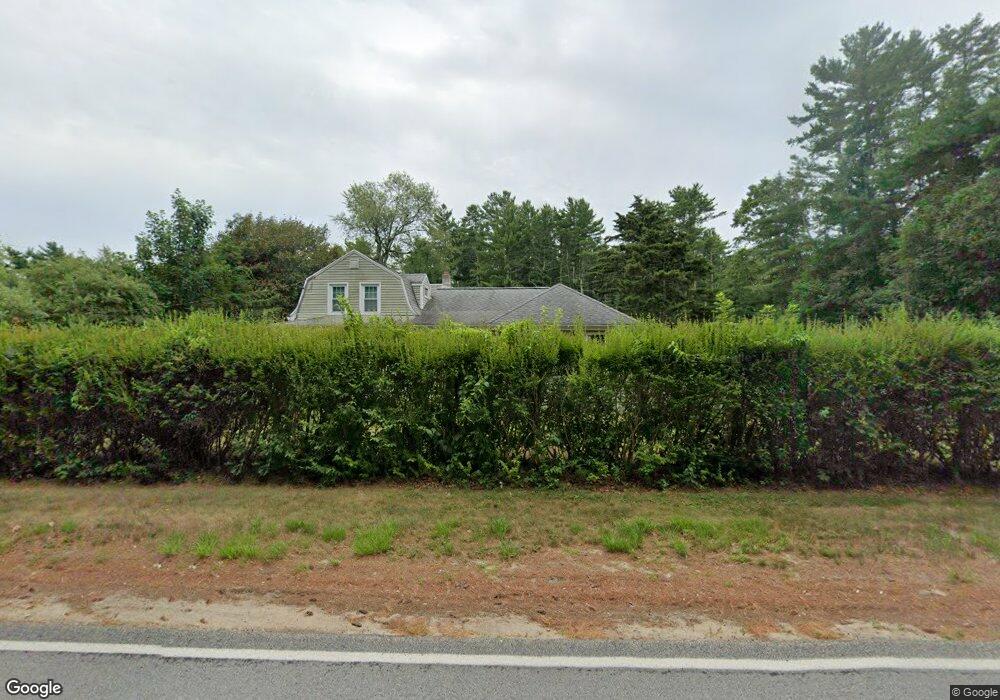
83 High St Carver, MA 02330
Estimated Value: $549,215 - $608,000
3
Beds
1
Bath
1,489
Sq Ft
$387/Sq Ft
Est. Value
About This Home
This home is located at 83 High St, Carver, MA 02330 and is currently estimated at $575,554, approximately $386 per square foot. 83 High St is a home located in Plymouth County with nearby schools including Carver Elementary School and Carver Middle/High School.
Ownership History
Date
Name
Owned For
Owner Type
Purchase Details
Closed on
Aug 27, 2002
Sold by
Kassie Orzechowski Ft and Orzechowaski C
Bought by
Orzechowski Charles
Current Estimated Value
Home Financials for this Owner
Home Financials are based on the most recent Mortgage that was taken out on this home.
Original Mortgage
$180,000
Interest Rate
6.57%
Mortgage Type
Purchase Money Mortgage
Create a Home Valuation Report for This Property
The Home Valuation Report is an in-depth analysis detailing your home's value as well as a comparison with similar homes in the area
Home Values in the Area
Average Home Value in this Area
Purchase History
| Date | Buyer | Sale Price | Title Company |
|---|---|---|---|
| Orzechowski Charles | $200,000 | -- |
Source: Public Records
Mortgage History
| Date | Status | Borrower | Loan Amount |
|---|---|---|---|
| Open | Orzechowski Charles | $220,000 | |
| Closed | Orzechowski Charles | $35,000 | |
| Closed | Orzechowski Charles | $200,000 | |
| Closed | Orzechowski Charles | $180,000 |
Source: Public Records
Tax History
| Year | Tax Paid | Tax Assessment Tax Assessment Total Assessment is a certain percentage of the fair market value that is determined by local assessors to be the total taxable value of land and additions on the property. | Land | Improvement |
|---|---|---|---|---|
| 2025 | $6,751 | $486,700 | $159,100 | $327,600 |
| 2024 | $6,382 | $450,400 | $156,000 | $294,400 |
| 2023 | $6,193 | $424,500 | $156,000 | $268,500 |
| 2022 | $5,865 | $367,000 | $133,400 | $233,600 |
| 2021 | $5,436 | $320,900 | $119,100 | $201,800 |
| 2020 | $5,190 | $301,900 | $111,300 | $190,600 |
| 2019 | $5,011 | $293,900 | $108,100 | $185,800 |
| 2018 | $4,919 | $279,000 | $108,100 | $170,900 |
| 2017 | $4,599 | $260,000 | $104,000 | $156,000 |
| 2016 | $4,235 | $248,700 | $99,000 | $149,700 |
| 2015 | $4,164 | $244,800 | $99,000 | $145,800 |
| 2014 | $4,235 | $249,000 | $125,200 | $123,800 |
Source: Public Records
Map
Nearby Homes
Your Personal Tour Guide
Ask me questions while you tour the home.