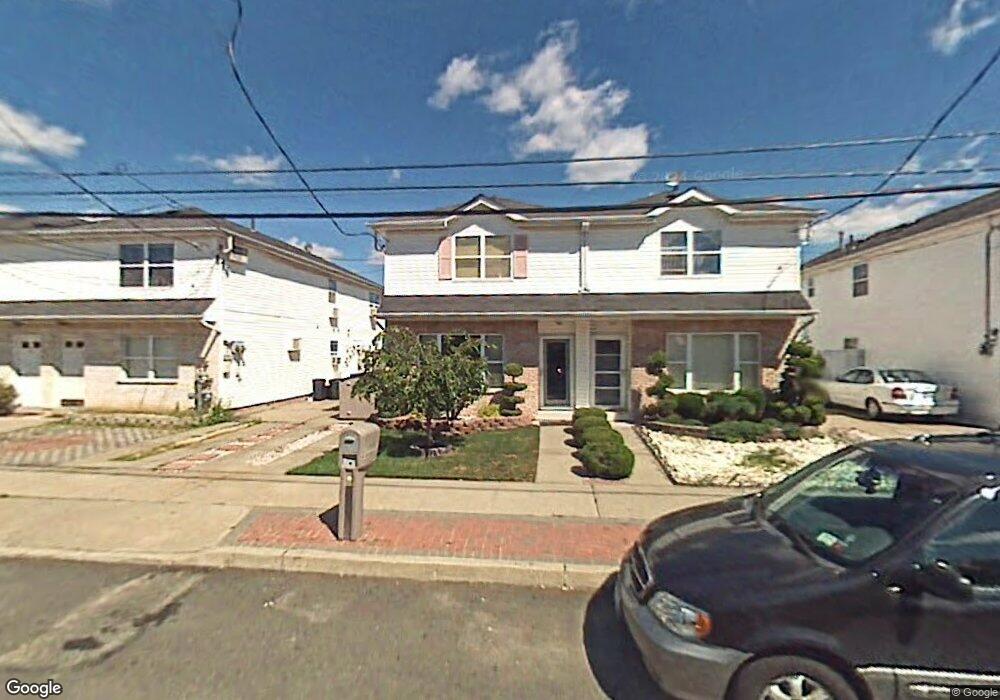
83 Isernia Ave Staten Island, NY 10306
Oakwood NeighborhoodEstimated Value: $695,447 - $742,000
3
Beds
3
Baths
1,600
Sq Ft
$451/Sq Ft
Est. Value
About This Home
This home is located at 83 Isernia Ave, Staten Island, NY 10306 and is currently estimated at $721,862, approximately $451 per square foot. 83 Isernia Ave is a home located in Richmond County with nearby schools including P.S. 41 The Stephanie a Vierno School, Is 2 George L Egbert, and New Dorp High School.
Ownership History
Date
Name
Owned For
Owner Type
Purchase Details
Closed on
Mar 7, 2012
Sold by
Rinato Lisa
Bought by
Rinato Lisa and Rinato Joseph
Current Estimated Value
Purchase Details
Closed on
Nov 22, 2008
Sold by
Rinato Joseph
Bought by
Rinato Lisa
Purchase Details
Closed on
May 19, 1997
Sold by
Ingoglia Frank P and Ingoglia John V
Bought by
Rinato Joseph and Rinato Lisa
Home Financials for this Owner
Home Financials are based on the most recent Mortgage that was taken out on this home.
Original Mortgage
$156,750
Outstanding Balance
$21,413
Interest Rate
7.97%
Estimated Equity
$700,449
Purchase Details
Closed on
Jul 3, 1996
Sold by
Staten Land Development Corp
Bought by
Ingoglia Frank and Ingoglia John V
Home Financials for this Owner
Home Financials are based on the most recent Mortgage that was taken out on this home.
Original Mortgage
$147,240
Interest Rate
8.27%
Mortgage Type
FHA
Create a Home Valuation Report for This Property
The Home Valuation Report is an in-depth analysis detailing your home's value as well as a comparison with similar homes in the area
Home Values in the Area
Average Home Value in this Area
Purchase History
| Date | Buyer | Sale Price | Title Company |
|---|---|---|---|
| Rinato Lisa | -- | Fidelity Natl Title Ins Co | |
| Rinato Lisa | -- | None Available | |
| Rinato Joseph | $165,000 | -- | |
| Ingoglia Frank | $162,500 | -- |
Source: Public Records
Mortgage History
| Date | Status | Borrower | Loan Amount |
|---|---|---|---|
| Open | Rinato Joseph | $156,750 | |
| Previous Owner | Ingoglia Frank | $147,240 |
Source: Public Records
Tax History Compared to Growth
Tax History
| Year | Tax Paid | Tax Assessment Tax Assessment Total Assessment is a certain percentage of the fair market value that is determined by local assessors to be the total taxable value of land and additions on the property. | Land | Improvement |
|---|---|---|---|---|
| 2025 | $5,067 | $39,360 | $4,346 | $35,014 |
| 2024 | $5,067 | $34,860 | $4,907 | $29,953 |
| 2023 | $5,085 | $25,039 | $4,449 | $20,590 |
| 2022 | $4,716 | $34,680 | $6,780 | $27,900 |
| 2021 | $4,690 | $34,620 | $6,780 | $27,840 |
| 2020 | $4,450 | $29,880 | $6,780 | $23,100 |
| 2019 | $4,398 | $30,600 | $6,780 | $23,820 |
| 2018 | $4,254 | $20,866 | $5,017 | $15,849 |
| 2017 | $4,013 | $19,685 | $5,575 | $14,110 |
| 2016 | $3,713 | $18,571 | $6,321 | $12,250 |
| 2015 | $3,362 | $17,520 | $5,640 | $11,880 |
| 2014 | $3,362 | $17,520 | $5,640 | $11,880 |
Source: Public Records
Map
Nearby Homes