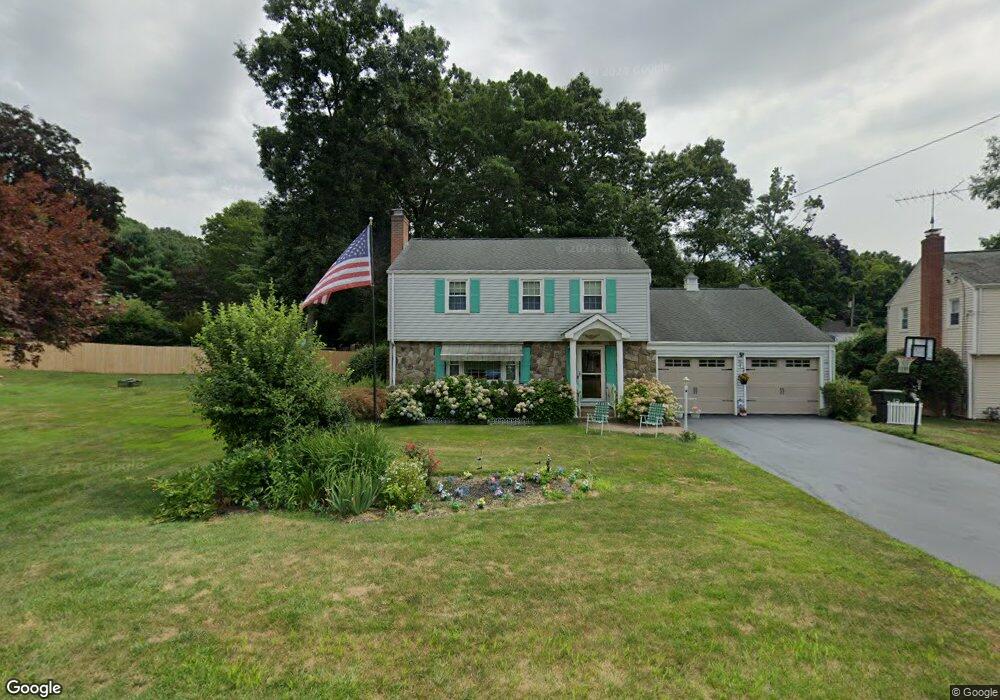
83 Ivy Ln Newington, CT 06111
Estimated Value: $435,000 - $511,000
3
Beds
3
Baths
1,893
Sq Ft
$243/Sq Ft
Est. Value
About This Home
This home is located at 83 Ivy Ln, Newington, CT 06111 and is currently estimated at $460,563, approximately $243 per square foot. 83 Ivy Ln is a home located in Hartford County with nearby schools including Elizabeth Green School, Martin Kellogg Middle School, and Newington High School.
Ownership History
Date
Name
Owned For
Owner Type
Purchase Details
Closed on
May 15, 2025
Sold by
Papa Barbara P Est and Coulom
Bought by
Almonte Tyler J and Almonte Danielle M
Current Estimated Value
Home Financials for this Owner
Home Financials are based on the most recent Mortgage that was taken out on this home.
Original Mortgage
$416,150
Outstanding Balance
$414,673
Interest Rate
6.64%
Mortgage Type
VA
Estimated Equity
$45,890
Purchase Details
Closed on
Nov 21, 2024
Sold by
Papa Sebastian R
Bought by
Sebastian Papa T and Sebastian Papa
Purchase Details
Closed on
Jun 27, 2002
Sold by
Trichka Robert E and Trichka Warrena B
Bought by
Papa Sebastian R and Papa Barbara P
Create a Home Valuation Report for This Property
The Home Valuation Report is an in-depth analysis detailing your home's value as well as a comparison with similar homes in the area
Home Values in the Area
Average Home Value in this Area
Purchase History
| Date | Buyer | Sale Price | Title Company |
|---|---|---|---|
| Almonte Tyler J | $435,000 | None Available | |
| Almonte Tyler J | $435,000 | None Available | |
| Sebastian Papa T | -- | None Available | |
| Sebastian Papa T | -- | None Available | |
| Papa Sebastian R | $260,000 | -- | |
| Papa Sebastian R | $260,000 | -- |
Source: Public Records
Mortgage History
| Date | Status | Borrower | Loan Amount |
|---|---|---|---|
| Open | Almonte Tyler J | $416,150 | |
| Closed | Almonte Tyler J | $416,150 | |
| Previous Owner | Papa Sebastian R | $128,400 | |
| Previous Owner | Papa Sebastian R | $2,056 | |
| Previous Owner | Papa Sebastian R | $142,000 |
Source: Public Records
Tax History Compared to Growth
Tax History
| Year | Tax Paid | Tax Assessment Tax Assessment Total Assessment is a certain percentage of the fair market value that is determined by local assessors to be the total taxable value of land and additions on the property. | Land | Improvement |
|---|---|---|---|---|
| 2024 | $7,246 | $182,660 | $55,680 | $126,980 |
| 2023 | $7,007 | $182,660 | $55,680 | $126,980 |
| 2022 | $7,031 | $182,660 | $55,680 | $126,980 |
| 2021 | $7,089 | $182,660 | $55,680 | $126,980 |
| 2020 | $7,471 | $190,190 | $55,670 | $134,520 |
| 2019 | $7,503 | $190,190 | $55,670 | $134,520 |
| 2018 | $7,322 | $190,190 | $55,670 | $134,520 |
| 2017 | $6,959 | $190,190 | $55,670 | $134,520 |
| 2016 | $6,799 | $190,190 | $55,670 | $134,520 |
| 2014 | $6,390 | $183,770 | $55,660 | $128,110 |
Source: Public Records
Map
Nearby Homes
- 274 Cedarwood Ln
- 91 Centerwood Rd
- 81 Southwood Rd
- 181 E Robbins Ave
- 111 Brockett St
- 29 Chaplin St Unit 29
- 297 Walsh Ave
- 75 Cider Brook Dr
- 5 Copper Beech Ln
- 137 Superior Ave
- 7 Barrington Dr Unit C
- 57 Welles Dr
- 376 Cypress Rd
- 828 Wells Rd
- 28 Kirkham St
- 265 Back Ln
- 268 Goff Rd
- 20 Dogwood Ln
- 76 Luca Lane Homesite 8
- 61 Luca Ln