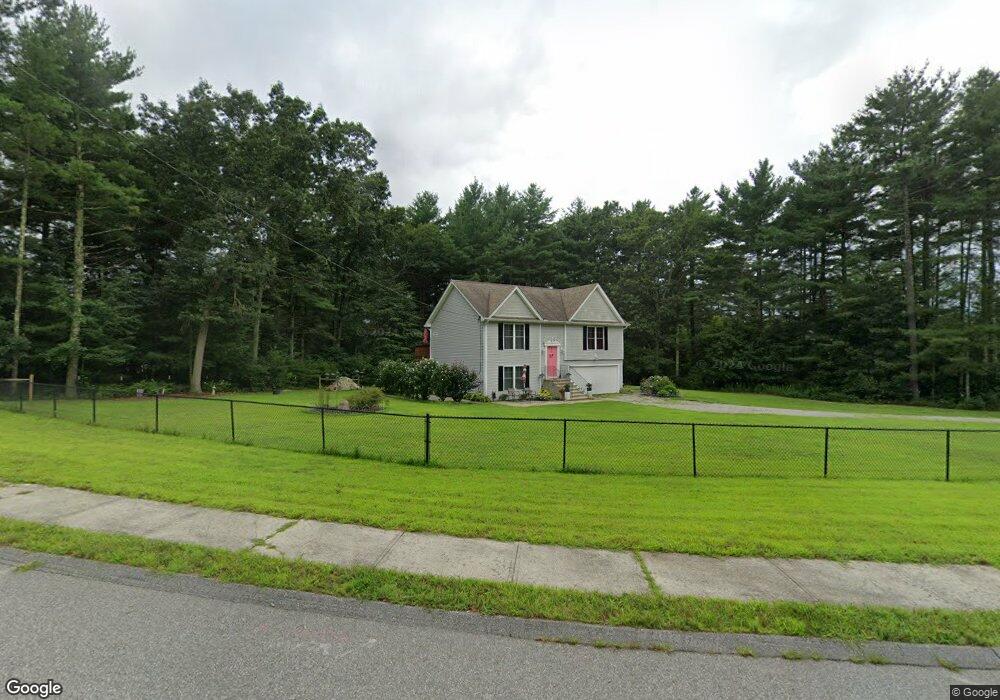
83 Juniper Way Brooklyn, CT 06234
Brooklyn NeighborhoodEstimated Value: $398,000 - $436,000
3
Beds
2
Baths
1,040
Sq Ft
$404/Sq Ft
Est. Value
About This Home
This home is located at 83 Juniper Way, Brooklyn, CT 06234 and is currently estimated at $419,975, approximately $403 per square foot. 83 Juniper Way is a home with nearby schools including Brooklyn Elementary School, Brooklyn Middle School, and St. James Parochial School.
Ownership History
Date
Name
Owned For
Owner Type
Purchase Details
Closed on
Sep 17, 2012
Sold by
Juniper Hills Invest L
Bought by
Trakas Alycia M
Current Estimated Value
Home Financials for this Owner
Home Financials are based on the most recent Mortgage that was taken out on this home.
Original Mortgage
$204,081
Outstanding Balance
$141,216
Interest Rate
3.57%
Estimated Equity
$278,759
Create a Home Valuation Report for This Property
The Home Valuation Report is an in-depth analysis detailing your home's value as well as a comparison with similar homes in the area
Home Values in the Area
Average Home Value in this Area
Purchase History
| Date | Buyer | Sale Price | Title Company |
|---|---|---|---|
| Trakas Alycia M | $200,000 | -- | |
| Trakas Alycia M | $200,000 | -- |
Source: Public Records
Mortgage History
| Date | Status | Borrower | Loan Amount |
|---|---|---|---|
| Open | Trakas Alycia M | $204,081 | |
| Closed | Trakas Alycia M | $204,081 |
Source: Public Records
Tax History
| Year | Tax Paid | Tax Assessment Tax Assessment Total Assessment is a certain percentage of the fair market value that is determined by local assessors to be the total taxable value of land and additions on the property. | Land | Improvement |
|---|---|---|---|---|
| 2025 | $6,540 | $280,920 | $40,690 | $240,230 |
| 2024 | $5,004 | $169,400 | $29,700 | $139,700 |
| 2023 | $4,845 | $169,400 | $29,700 | $139,700 |
| 2022 | $4,655 | $169,400 | $29,700 | $139,700 |
| 2021 | $4,476 | $169,400 | $29,700 | $139,700 |
| 2020 | $4,222 | $146,000 | $35,000 | $111,000 |
| 2019 | $4,222 | $146,000 | $35,000 | $111,000 |
| 2018 | $4,101 | $146,000 | $35,000 | $111,000 |
| 2017 | $3,955 | $146,000 | $35,000 | $111,000 |
| 2016 | $3,846 | $146,000 | $35,000 | $111,000 |
| 2015 | $3,507 | $149,700 | $42,000 | $107,700 |
| 2014 | $3,507 | $149,700 | $42,000 | $107,700 |
Source: Public Records
Map
Nearby Homes
- 147 South St
- 405 Providence Rd
- 423 Providence Rd
- 454 Providence Rd
- 0 Allen Hill Rd Unit 24140370
- 10 Cote Dr
- 53 S Main St
- 37 Cady St
- 0 Providence Rd Unit 24080985
- 35 S Main St
- 63 Gorman Rd
- 20 Wauregan Rd
- 23 Tiffany St
- 33 Junior Ave
- 279 Gorman Rd
- 37 Katherine Ave
- 37 Ruth St
- 106 Water St
- 85 Furnace St
- 247 Green Hollow Rd
Your Personal Tour Guide
Ask me questions while you tour the home.