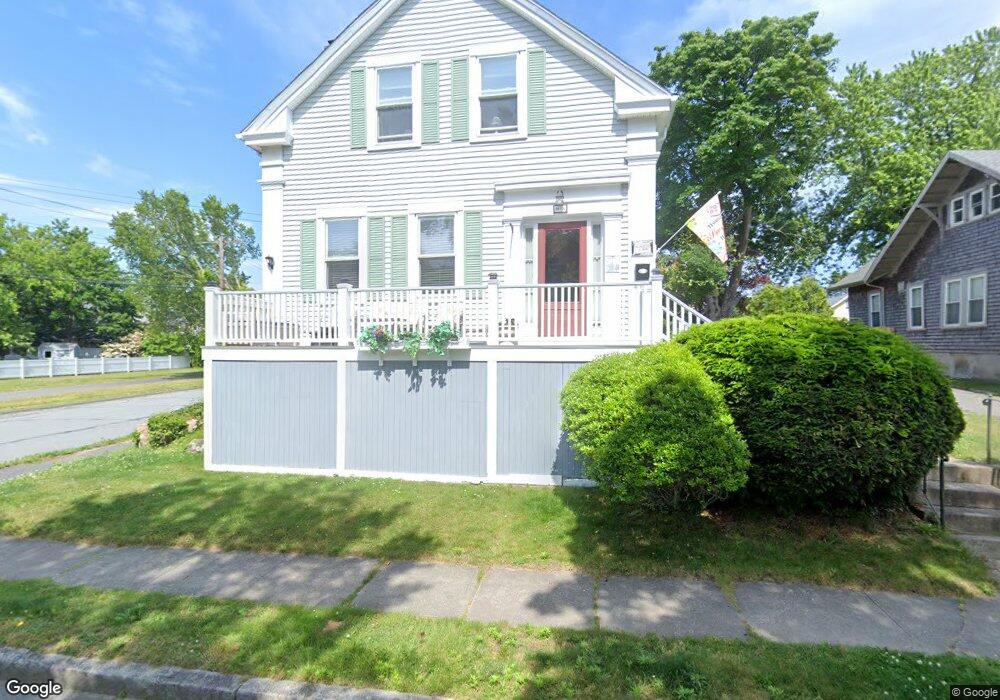
83 Laurel St Fairhaven, MA 02719
Estimated Value: $633,808 - $735,000
3
Beds
2
Baths
2,209
Sq Ft
$302/Sq Ft
Est. Value
About This Home
This home is located at 83 Laurel St, Fairhaven, MA 02719 and is currently estimated at $666,702, approximately $301 per square foot. 83 Laurel St is a home located in Bristol County with nearby schools including Fairhaven High School, City On A Hill Charter Public School New Bedford, and St. Joseph School.
Ownership History
Date
Name
Owned For
Owner Type
Purchase Details
Closed on
Dec 29, 1993
Sold by
Mendell Thomas R and Mendell Barbara A
Bought by
Mccann Michael E and Mccann Susan M
Current Estimated Value
Create a Home Valuation Report for This Property
The Home Valuation Report is an in-depth analysis detailing your home's value as well as a comparison with similar homes in the area
Home Values in the Area
Average Home Value in this Area
Purchase History
| Date | Buyer | Sale Price | Title Company |
|---|---|---|---|
| Mccann Michael E | $158,000 | -- |
Source: Public Records
Mortgage History
| Date | Status | Borrower | Loan Amount |
|---|---|---|---|
| Open | Mccann Michael E | $175,000 | |
| Closed | Mccann Michael E | $178,000 | |
| Closed | Mccann Michael E | $132,000 |
Source: Public Records
Tax History
| Year | Tax Paid | Tax Assessment Tax Assessment Total Assessment is a certain percentage of the fair market value that is determined by local assessors to be the total taxable value of land and additions on the property. | Land | Improvement |
|---|---|---|---|---|
| 2025 | $50 | $537,800 | $245,500 | $292,300 |
| 2024 | $4,825 | $522,700 | $245,500 | $277,200 |
| 2023 | $4,684 | $470,800 | $211,800 | $259,000 |
| 2022 | $4,508 | $441,100 | $192,900 | $248,200 |
| 2021 | $3,544 | $385,000 | $175,400 | $209,600 |
| 2020 | $3,389 | $385,000 | $175,400 | $209,600 |
| 2019 | $3,258 | $343,000 | $150,300 | $192,700 |
| 2018 | $3,813 | $326,600 | $143,000 | $183,600 |
| 2017 | $2,934 | $308,900 | $137,600 | $171,300 |
| 2016 | $3,549 | $291,400 | $134,900 | $156,500 |
| 2015 | $3,506 | $288,600 | $134,900 | $153,700 |
Source: Public Records
Map
Nearby Homes
- 32 Green St
- 11 Lawton St
- 58 Washington St
- 2 Washburn Ave
- 24 Middle St
- 32 Cedar St
- 0 Nulands Neck Unit 73286360
- 145 Pleasant St
- 8 Washington St
- 39 Christian St
- 77 Adams St
- 67 Bridge St
- 8 Manor Dr
- 181 Washington St
- 138 Main St Unit 13
- 16 Ash St
- 15 School St
- 24 Academy Ave
- 58 Bayview Ave
- 27 Bayview Ave
Your Personal Tour Guide
Ask me questions while you tour the home.