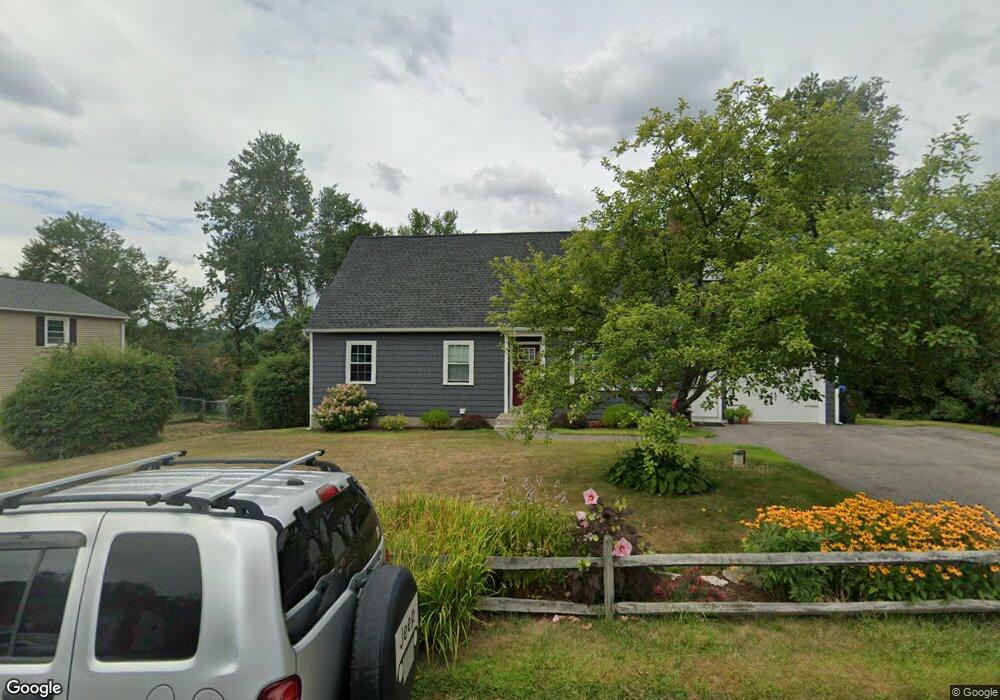
83 Loretta Rd Torrington, CT 06790
Estimated Value: $368,000 - $391,000
3
Beds
3
Baths
1,785
Sq Ft
$213/Sq Ft
Est. Value
About This Home
This home is located at 83 Loretta Rd, Torrington, CT 06790 and is currently estimated at $379,919, approximately $212 per square foot. 83 Loretta Rd is a home located in Litchfield County with nearby schools including Torrington Middle School, Torrington High School, and Torrington Christian Academy.
Ownership History
Date
Name
Owned For
Owner Type
Purchase Details
Closed on
Dec 18, 2019
Sold by
Waldron Steven
Bought by
Waldron Sherri
Current Estimated Value
Purchase Details
Closed on
Feb 25, 1999
Sold by
Healy Elizabeth K
Bought by
Waldron Steven G and Waldron Sherri L
Home Financials for this Owner
Home Financials are based on the most recent Mortgage that was taken out on this home.
Original Mortgage
$137,750
Interest Rate
6.78%
Purchase Details
Closed on
Nov 29, 1995
Sold by
Hart Brian W and Hart Martha N
Bought by
Healy Christopher C and Healy Elizabeth
Home Financials for this Owner
Home Financials are based on the most recent Mortgage that was taken out on this home.
Original Mortgage
$63,900
Interest Rate
7.37%
Mortgage Type
Unknown
Purchase Details
Closed on
Mar 13, 1989
Sold by
Farmer Catherine
Bought by
Hart Brian W
Create a Home Valuation Report for This Property
The Home Valuation Report is an in-depth analysis detailing your home's value as well as a comparison with similar homes in the area
Home Values in the Area
Average Home Value in this Area
Purchase History
| Date | Buyer | Sale Price | Title Company |
|---|---|---|---|
| Waldron Sherri | -- | None Available | |
| Waldron Steven G | $145,000 | -- | |
| Healy Christopher C | $154,000 | -- | |
| Hart Brian W | $125,000 | -- |
Source: Public Records
Mortgage History
| Date | Status | Borrower | Loan Amount |
|---|---|---|---|
| Previous Owner | Hart Brian W | $32,500 | |
| Previous Owner | Hart Brian W | $137,750 | |
| Previous Owner | Hart Brian W | $63,900 | |
| Previous Owner | Hart Brian W | $118,000 |
Source: Public Records
Tax History
| Year | Tax Paid | Tax Assessment Tax Assessment Total Assessment is a certain percentage of the fair market value that is determined by local assessors to be the total taxable value of land and additions on the property. | Land | Improvement |
|---|---|---|---|---|
| 2025 | $8,877 | $230,860 | $30,520 | $200,340 |
| 2024 | $5,287 | $110,210 | $30,550 | $79,660 |
| 2023 | $5,286 | $110,210 | $30,550 | $79,660 |
| 2022 | $5,195 | $110,210 | $30,550 | $79,660 |
| 2021 | $5,088 | $110,210 | $30,550 | $79,660 |
| 2020 | $5,088 | $110,210 | $30,550 | $79,660 |
| 2019 | $5,195 | $112,510 | $34,620 | $77,890 |
| 2018 | $4,790 | $103,750 | $34,620 | $69,130 |
| 2017 | $5,147 | $112,510 | $34,620 | $77,890 |
| 2016 | $4,747 | $103,750 | $34,620 | $69,130 |
| 2015 | $4,747 | $103,750 | $34,620 | $69,130 |
| 2014 | $5,531 | $152,280 | $63,560 | $88,720 |
Source: Public Records
Map
Nearby Homes
- 65 Oak Meadow Ln Unit 65
- 111 Oxbow Dr
- 323 Highfield Dr
- 272 Edgewood Dr
- 660 Torringford St
- 32 Ridgewood Dr
- 146 Highfield Dr
- 0 Torringford St W
- 14 Hannah Way
- 23 Hannah Way
- 151 Highview Dr
- 179 Greenridge Rd
- 175 Ramstein Rd
- 164 Birge Park Rd
- 195 Torrington Heights Rd
- 238 Barton St
- 101 Durand St
- 98 Wheeler Ln
- 340 Hillside Ave
- 83 Birge St
- 99 Loretta Rd
- 67 Loretta Rd
- 75 Castlewood Ln
- 70 Loretta Rd
- 57 Castlewood Ln
- 53 Loretta Rd
- 115 Loretta Rd
- 84 Loretta Rd
- 100 Loretta Rd
- 89 Castlewood Ln
- 37 Castlewood Ln
- 60 Loretta Rd
- 80 Castlewood Ln
- 89 Shirley Rd
- 62 Castlewood Ln
- 90 Castlewood Ln
- 131 Loretta Rd
- 23 Castlewood Ln
- 39 Loretta Rd
- 50 Loretta Rd
Your Personal Tour Guide
Ask me questions while you tour the home.