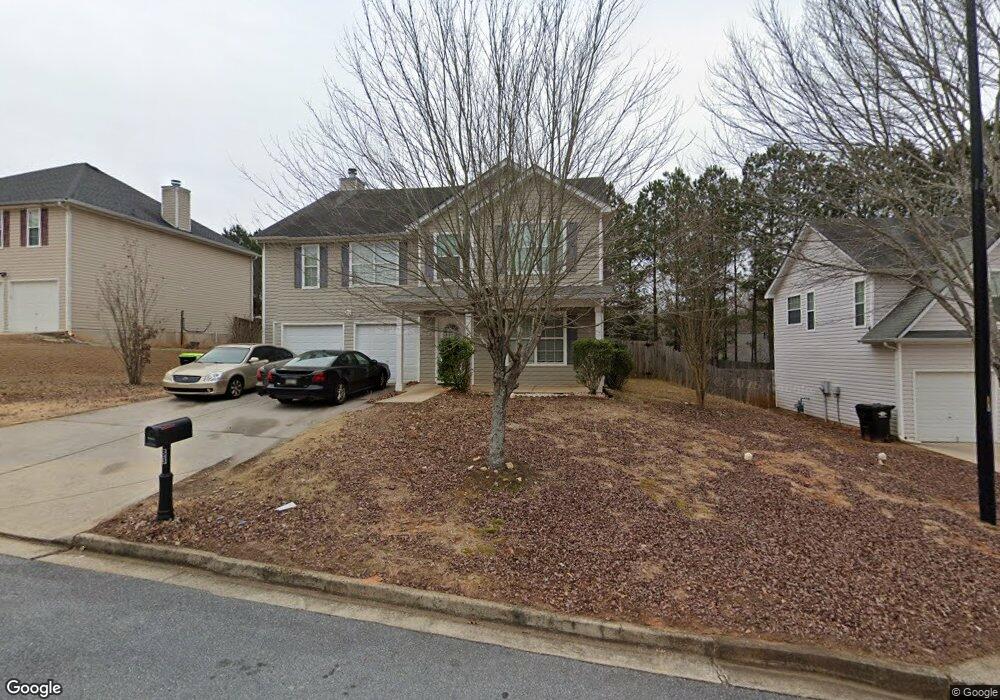
83 Margaret Crossing Unit 112 Dallas, GA 30132
East Paulding County NeighborhoodEstimated Value: $356,274 - $406,000
5
Beds
3
Baths
2,784
Sq Ft
$134/Sq Ft
Est. Value
About This Home
This home is located at 83 Margaret Crossing Unit 112, Dallas, GA 30132 and is currently estimated at $372,069, approximately $133 per square foot. 83 Margaret Crossing Unit 112 is a home located in Paulding County with nearby schools including W.C. Abney Elementary School, Lena Mae Moses Middle School, and East Paulding High School.
Ownership History
Date
Name
Owned For
Owner Type
Purchase Details
Closed on
Oct 21, 2019
Sold by
Sable Javier Enmanuel
Bought by
Ih6 Property Georgia Lp
Current Estimated Value
Purchase Details
Closed on
Mar 13, 2017
Sold by
Rucker Ronald E
Bought by
Sable Javier Enmanuel
Home Financials for this Owner
Home Financials are based on the most recent Mortgage that was taken out on this home.
Original Mortgage
$189,012
Interest Rate
4.17%
Mortgage Type
FHA
Purchase Details
Closed on
Aug 4, 2009
Sold by
Legacy Communities Of Springfi
Bought by
Branch Bkng & Trust Co
Purchase Details
Closed on
Dec 15, 2006
Sold by
Legacy Communities Of Legacy P
Bought by
Rucker Ronald E
Home Financials for this Owner
Home Financials are based on the most recent Mortgage that was taken out on this home.
Original Mortgage
$190,200
Interest Rate
6.19%
Mortgage Type
VA
Create a Home Valuation Report for This Property
The Home Valuation Report is an in-depth analysis detailing your home's value as well as a comparison with similar homes in the area
Home Values in the Area
Average Home Value in this Area
Purchase History
| Date | Buyer | Sale Price | Title Company |
|---|---|---|---|
| Ih6 Property Georgia Lp | $222,458 | -- | |
| Sable Javier Enmanuel | $192,500 | -- | |
| Branch Bkng & Trust Co | $135,720 | -- | |
| Rucker Ronald E | $186,400 | -- |
Source: Public Records
Mortgage History
| Date | Status | Borrower | Loan Amount |
|---|---|---|---|
| Previous Owner | Sable Javier Enmanuel | $189,012 | |
| Previous Owner | Rucker Ronald E | $190,200 |
Source: Public Records
Tax History Compared to Growth
Tax History
| Year | Tax Paid | Tax Assessment Tax Assessment Total Assessment is a certain percentage of the fair market value that is determined by local assessors to be the total taxable value of land and additions on the property. | Land | Improvement |
|---|---|---|---|---|
| 2024 | $3,232 | $129,924 | $14,000 | $115,924 |
| 2023 | $3,553 | $136,292 | $14,000 | $122,292 |
| 2022 | $3,138 | $120,360 | $14,000 | $106,360 |
| 2021 | $2,538 | $87,348 | $14,000 | $73,348 |
| 2020 | $2,510 | $84,520 | $14,000 | $70,520 |
| 2019 | $2,395 | $79,480 | $14,000 | $65,480 |
| 2018 | $2,228 | $73,960 | $16,000 | $57,960 |
| 2017 | $2,307 | $75,520 | $18,000 | $57,520 |
| 2016 | $1,979 | $65,440 | $8,000 | $57,440 |
| 2015 | $1,775 | $57,680 | $8,000 | $49,680 |
| 2014 | $1,614 | $51,120 | $8,000 | $43,120 |
| 2013 | -- | $40,960 | $8,000 | $32,960 |
Source: Public Records
Map
Nearby Homes
- 83 Margaret Crossing
- 69 Margaret Crossing
- 97 Margaret Crossing
- 0 Margaret Crossing Unit 8707453
- 0 Margaret Crossing Unit 7203348
- 0 Margaret Crossing Unit 8684408
- 0 Margaret Crossing Unit 8678240
- 0 Margaret Crossing Unit 7541664
- 0 Margaret Crossing Unit 3288906
- 0 Margaret Crossing Unit 7504559
- 0 Margaret Crossing Unit 7579654
- 0 Margaret Crossing Unit 8136694
- 44 Randy Way
- 58 Randy Way
- 49 Margaret Crossing
- 49 Margaret Crossing
- 95 Margaret Crossing
- 131 Margaret Crossing
- 80 Margaret Crossing
- 98 Margaret Crossing