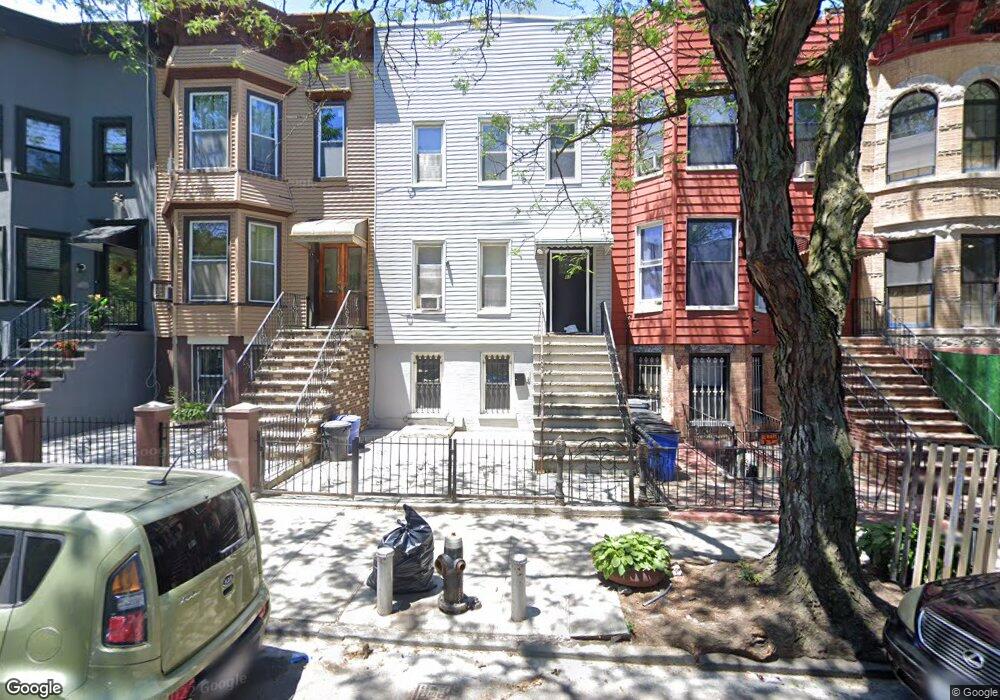
83 Moffat St Brooklyn, NY 11207
Bushwick NeighborhoodEstimated Value: $1,153,946 - $1,455,000
--
Bed
--
Bath
3,000
Sq Ft
$437/Sq Ft
Est. Value
About This Home
This home is located at 83 Moffat St, Brooklyn, NY 11207 and is currently estimated at $1,311,237, approximately $437 per square foot. 83 Moffat St is a home located in Kings County with nearby schools including P.S./I.S. 045 Horace E. Greene, Evergreen Middle School for Urban Exploration, and Achievement First Bushwick Charter School.
Ownership History
Date
Name
Owned For
Owner Type
Purchase Details
Closed on
Apr 19, 2024
Sold by
Stewart Deborah
Bought by
Deborah Stewart Trust and Deborah Stewart As Trustee
Current Estimated Value
Purchase Details
Closed on
Nov 2, 2017
Sold by
Stewart Deborah
Bought by
Stewart Deborah
Home Financials for this Owner
Home Financials are based on the most recent Mortgage that was taken out on this home.
Original Mortgage
$420,000
Interest Rate
3.88%
Mortgage Type
New Conventional
Purchase Details
Closed on
Oct 31, 2017
Sold by
Brown Jeff
Bought by
Stewart Deborah
Home Financials for this Owner
Home Financials are based on the most recent Mortgage that was taken out on this home.
Original Mortgage
$420,000
Interest Rate
3.88%
Mortgage Type
New Conventional
Purchase Details
Closed on
Jun 21, 2010
Sold by
Stewart Rose
Bought by
Stewart Deborah
Create a Home Valuation Report for This Property
The Home Valuation Report is an in-depth analysis detailing your home's value as well as a comparison with similar homes in the area
Home Values in the Area
Average Home Value in this Area
Purchase History
| Date | Buyer | Sale Price | Title Company |
|---|---|---|---|
| Deborah Stewart Trust | -- | -- | |
| Stewart Deborah | -- | -- | |
| Stewart Deborah | -- | -- | |
| Stewart Deborah | -- | -- | |
| Stewart Deborah | -- | -- | |
| Stewart Deborah | -- | -- |
Source: Public Records
Mortgage History
| Date | Status | Borrower | Loan Amount |
|---|---|---|---|
| Previous Owner | Stewart Deborah | $420,000 |
Source: Public Records
Tax History Compared to Growth
Tax History
| Year | Tax Paid | Tax Assessment Tax Assessment Total Assessment is a certain percentage of the fair market value that is determined by local assessors to be the total taxable value of land and additions on the property. | Land | Improvement |
|---|---|---|---|---|
| 2025 | $4,001 | $80,640 | $12,600 | $68,040 |
| 2024 | $4,001 | $77,340 | $12,600 | $64,740 |
| 2023 | $3,820 | $68,340 | $12,600 | $55,740 |
| 2022 | $3,547 | $55,920 | $12,600 | $43,320 |
| 2021 | $3,528 | $58,260 | $12,600 | $45,660 |
| 2020 | $2,646 | $63,360 | $12,600 | $50,760 |
| 2019 | $3,472 | $66,240 | $12,600 | $53,640 |
| 2018 | $3,195 | $15,675 | $2,720 | $12,955 |
| 2017 | $3,019 | $14,808 | $2,950 | $11,858 |
| 2016 | $2,793 | $13,971 | $3,757 | $10,214 |
| 2015 | $1,685 | $13,957 | $3,305 | $10,652 |
| 2014 | $1,685 | $13,833 | $3,930 | $9,903 |
Source: Public Records
Map
Nearby Homes
- 81 Moffat St
- 1411 Bushwick Ave Unit 3A
- 1411 Bushwick Ave Unit 4A
- 1411 Bushwick Ave Unit 5 B
- 1411 Bushwick Ave Unit 3 B
- 1411 Bushwick Ave Unit 3 C
- 1411 Bushwick Ave Unit 2 C
- 1411 Bushwick Ave Unit 2 B
- 1411 Bushwick Ave Unit 2 A
- 696 Chauncey St Unit 2R
- 696 Chauncey St Unit 3F
- 696 Chauncey St Unit 1R
- 696 Chauncey St Unit 3B
- 696 Chauncey St Unit 2A
- 105 Moffat St
- 735 Chauncey St
- 1408 Bushwick Ave
- 1404 Bushwick Ave Unit 1
- 87A Cooper St Unit 2-A
- 87A Cooper St Unit 4-A
- 81 Moffat St Unit Building
- 85 Moffat St
- 79 Moffat St
- 87 Moffat St Unit 2
- 87 Moffat St
- 87 Moffat St Unit 1
- 87 Moffat St Unit 3
- 87 Moffat St Unit GARDEN
- 77 Moffat St
- 89 Moffat St
- 75 Moffat St
- 91 Moffat St
- 73 Moffat St
- 93 Moffat St
- 93 Moffat St
- 93 Moffat St
- 78 Cooper St
- 76A Cooper St Unit 4
- 76A Cooper St Unit 1
- 76A Cooper St