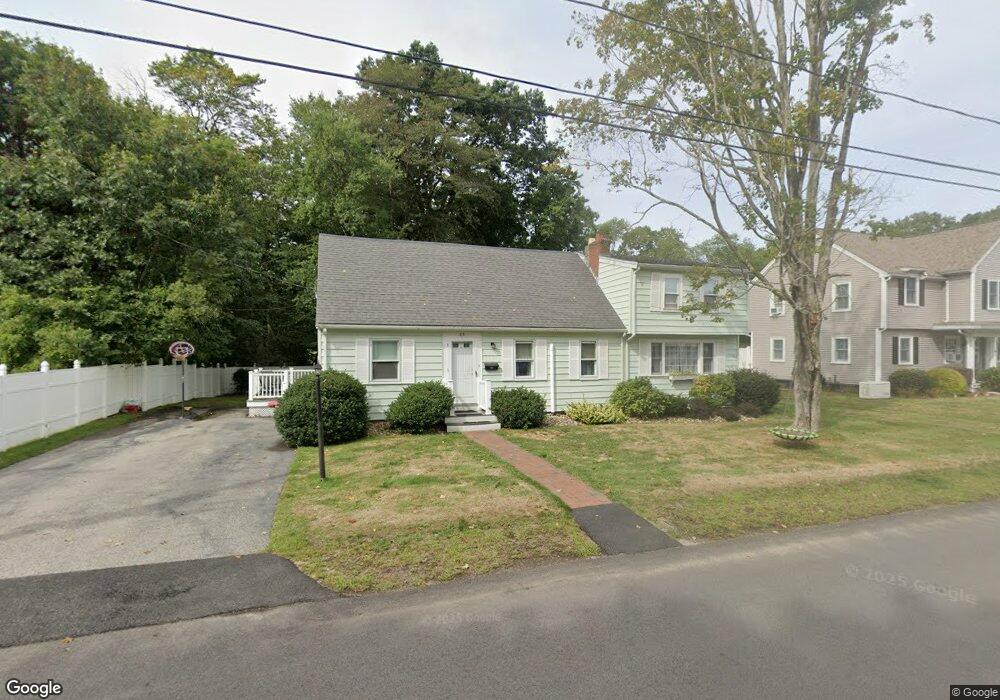
83 Moncrief Rd Rockland, MA 02370
Estimated Value: $607,000 - $666,000
Studio
2
Baths
2,128
Sq Ft
$302/Sq Ft
Est. Value
About This Home
This home is located at 83 Moncrief Rd, Rockland, MA 02370 and is currently estimated at $643,529, approximately $302 per square foot. 83 Moncrief Rd is a home located in Plymouth County with nearby schools including Rockland Senior High School, Calvary Chapel Academy, and Holy Family Elementary School.
Ownership History
Date
Name
Owned For
Owner Type
Purchase Details
Closed on
Oct 6, 2022
Sold by
Deborah M Connell T
Bought by
Connell Irt
Current Estimated Value
Purchase Details
Closed on
May 31, 2013
Sold by
Connell Deborah M
Bought by
Deborah M Connell T
Purchase Details
Closed on
Jan 25, 2013
Sold by
Connell Joseph F Est
Bought by
Connell Deborah M
Create a Home Valuation Report for This Property
The Home Valuation Report is an in-depth analysis detailing your home's value as well as a comparison with similar homes in the area
Home Values in the Area
Average Home Value in this Area
Purchase History
| Date | Buyer | Sale Price | Title Company |
|---|---|---|---|
| Connell Irt | -- | None Available | |
| Deborah M Connell T | -- | -- | |
| Connell Deborah M | -- | -- |
Source: Public Records
Mortgage History
| Date | Status | Borrower | Loan Amount |
|---|---|---|---|
| Previous Owner | Connell Deborah M | $20,000 | |
| Previous Owner | Connell Deborah M | $32,000 |
Source: Public Records
Tax History
| Year | Tax Paid | Tax Assessment Tax Assessment Total Assessment is a certain percentage of the fair market value that is determined by local assessors to be the total taxable value of land and additions on the property. | Land | Improvement |
|---|---|---|---|---|
| 2025 | $8,335 | $609,700 | $261,700 | $348,000 |
| 2024 | $8,092 | $575,500 | $246,900 | $328,600 |
| 2023 | $7,889 | $518,300 | $216,600 | $301,700 |
| 2022 | $7,613 | $454,500 | $188,300 | $266,200 |
| 2021 | $7,154 | $414,000 | $171,200 | $242,800 |
| 2020 | $6,955 | $397,400 | $163,100 | $234,300 |
| 2019 | $6,840 | $381,700 | $155,300 | $226,400 |
| 2018 | $6,648 | $364,900 | $162,400 | $202,500 |
| 2017 | $6,409 | $346,800 | $162,400 | $184,400 |
| 2016 | $6,211 | $335,900 | $156,200 | $179,700 |
| 2015 | $5,928 | $311,500 | $146,000 | $165,500 |
| 2014 | $5,586 | $304,600 | $143,100 | $161,500 |
Source: Public Records
Map
Nearby Homes
- 9 Old Market St
- 823 Market St
- 117 Liberty St
- 5 Pat Rose Way
- 696 Summer St
- 215 Market St
- 810 Brookline Way
- 643 Summer St
- 186 Vernon St
- 41 Winter Cir
- 15 Bradford St
- 50 Linden Park
- 63 Webster St
- 225 W Water St
- 191 Summer St
- 103 Grove St Unit 349
- 0 W Water St
- 119 Grove St Unit 234
- 135 Grove St Unit 123
- 135 Grove St Unit 115
Your Personal Tour Guide
Ask me questions while you tour the home.