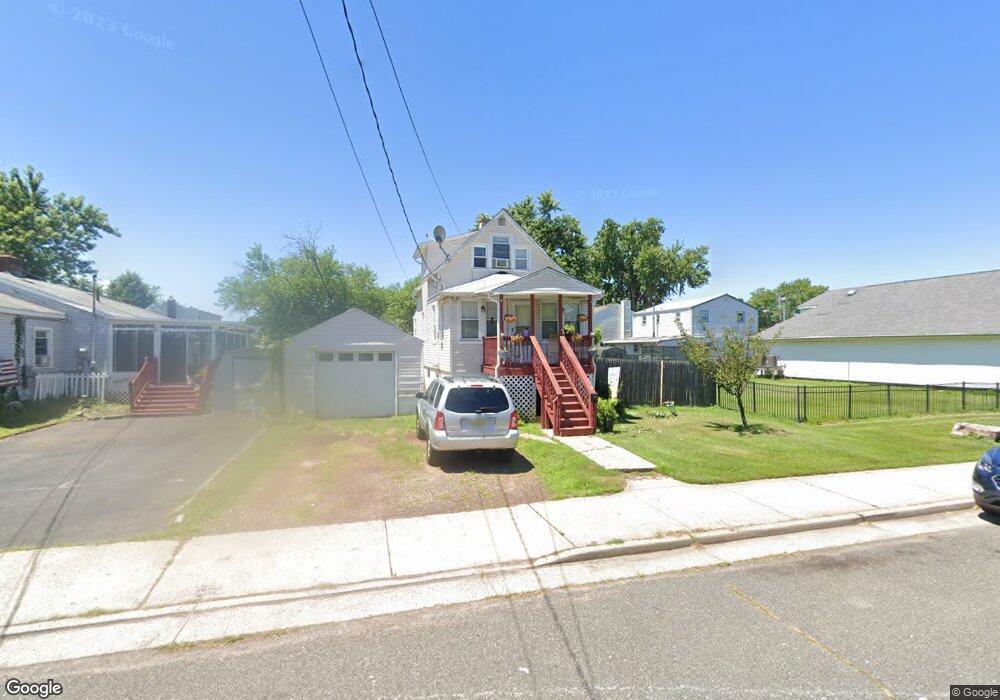
83 Myrtle Ave Keansburg, NJ 07734
Estimated Value: $331,000 - $413,000
3
Beds
1
Bath
848
Sq Ft
$433/Sq Ft
Est. Value
About This Home
This home is located at 83 Myrtle Ave, Keansburg, NJ 07734 and is currently estimated at $367,157, approximately $432 per square foot. 83 Myrtle Ave is a home located in Monmouth County with nearby schools including Joseph C. Caruso School, Joseph R. Bolger Middle School, and Keansburg High School.
Ownership History
Date
Name
Owned For
Owner Type
Purchase Details
Closed on
Aug 7, 2003
Sold by
Hazen Stanley
Bought by
Flannigan Michael
Current Estimated Value
Home Financials for this Owner
Home Financials are based on the most recent Mortgage that was taken out on this home.
Original Mortgage
$152,250
Outstanding Balance
$69,963
Interest Rate
6.22%
Estimated Equity
$297,194
Purchase Details
Closed on
Apr 6, 2000
Sold by
Fisher Tammy
Bought by
Hazen Stanley
Home Financials for this Owner
Home Financials are based on the most recent Mortgage that was taken out on this home.
Original Mortgage
$89,264
Interest Rate
8.26%
Mortgage Type
FHA
Purchase Details
Closed on
Dec 27, 1993
Sold by
Midstate Mtg
Bought by
Farrell James and Farrell Tammy
Home Financials for this Owner
Home Financials are based on the most recent Mortgage that was taken out on this home.
Original Mortgage
$58,000
Interest Rate
7%
Create a Home Valuation Report for This Property
The Home Valuation Report is an in-depth analysis detailing your home's value as well as a comparison with similar homes in the area
Home Values in the Area
Average Home Value in this Area
Purchase History
| Date | Buyer | Sale Price | Title Company |
|---|---|---|---|
| Flannigan Michael | $157,000 | -- | |
| Hazen Stanley | $90,000 | -- | |
| Farrell James | $62,000 | -- |
Source: Public Records
Mortgage History
| Date | Status | Borrower | Loan Amount |
|---|---|---|---|
| Open | Flannigan Michael | $152,250 | |
| Previous Owner | Hazen Stanley | $89,264 | |
| Previous Owner | Farrell James | $58,000 |
Source: Public Records
Tax History Compared to Growth
Tax History
| Year | Tax Paid | Tax Assessment Tax Assessment Total Assessment is a certain percentage of the fair market value that is determined by local assessors to be the total taxable value of land and additions on the property. | Land | Improvement |
|---|---|---|---|---|
| 2025 | $6,085 | $289,800 | $190,100 | $99,700 |
| 2024 | $6,143 | $276,600 | $178,700 | $97,900 |
| 2023 | $6,143 | $237,200 | $132,600 | $104,600 |
| 2022 | $4,972 | $216,400 | $114,600 | $101,800 |
| 2021 | $4,972 | $169,800 | $87,500 | $82,300 |
| 2020 | $4,600 | $114,800 | $47,300 | $67,500 |
| 2019 | $4,426 | $111,800 | $44,800 | $67,000 |
| 2018 | $4,316 | $110,400 | $44,800 | $65,600 |
| 2017 | $4,167 | $109,800 | $43,800 | $66,000 |
| 2016 | $3,898 | $106,900 | $33,800 | $73,100 |
| 2015 | $3,853 | $110,000 | $38,800 | $71,200 |
| 2014 | $3,811 | $112,000 | $48,800 | $63,200 |
Source: Public Records
Map
Nearby Homes