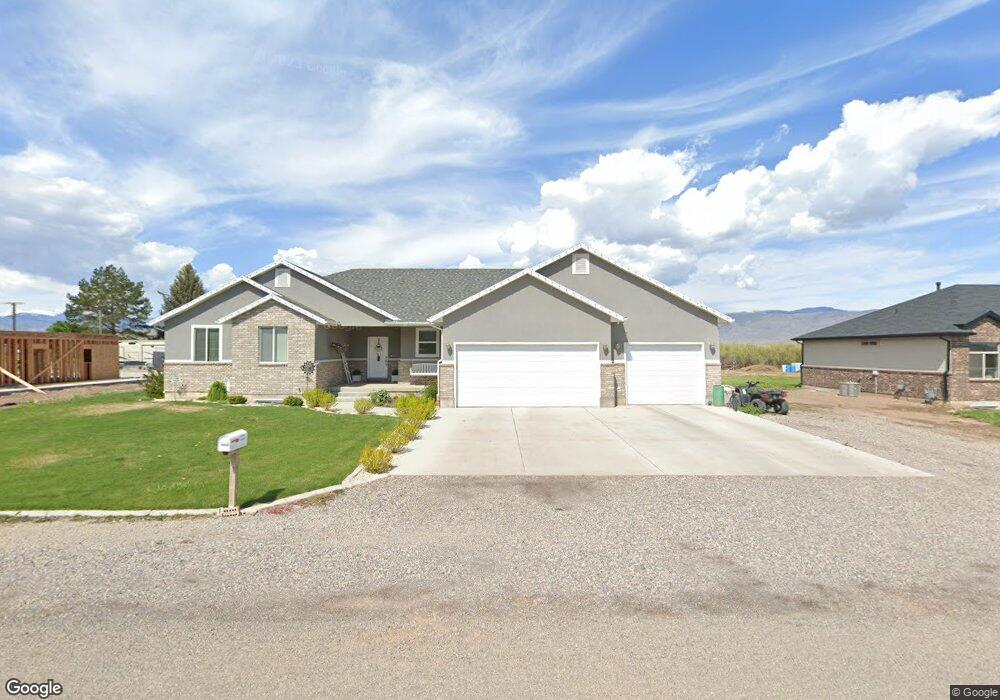
83 N 580 W Monroe, UT 84754
Monroe NeighborhoodEstimated Value: $477,000 - $637,764
--
Bed
--
Bath
1,821
Sq Ft
$313/Sq Ft
Est. Value
About This Home
This home is located at 83 N 580 W, Monroe, UT 84754 and is currently estimated at $569,691, approximately $312 per square foot. 83 N 580 W is a home with nearby schools including Monroe School, South Sevier Middle School, and South Sevier High School.
Ownership History
Date
Name
Owned For
Owner Type
Purchase Details
Closed on
Oct 2, 2023
Sold by
Nebeker Christy L and Nebeker Randy L
Bought by
Nebeker Randy L and Nebeker Christy L
Current Estimated Value
Home Financials for this Owner
Home Financials are based on the most recent Mortgage that was taken out on this home.
Original Mortgage
$53,000
Outstanding Balance
$48,752
Interest Rate
6.55%
Mortgage Type
New Conventional
Estimated Equity
$520,939
Purchase Details
Closed on
Oct 19, 2020
Sold by
Nebeker Randy L and Nebeker Christy L
Bought by
Nebeker Christy L and Nebeker Randy L
Home Financials for this Owner
Home Financials are based on the most recent Mortgage that was taken out on this home.
Original Mortgage
$320,000
Interest Rate
2.8%
Mortgage Type
New Conventional
Purchase Details
Closed on
Jul 18, 2016
Sold by
Mackay Robin
Bought by
Nebeker Randy L and Nebeker Christy L
Purchase Details
Closed on
Jan 3, 2013
Sold by
Tri-Baroness Llc
Bought by
Turf Farms Inc
Purchase Details
Closed on
Dec 12, 2012
Sold by
Tri Baroness Llc
Bought by
Tuft Farms Inc
Create a Home Valuation Report for This Property
The Home Valuation Report is an in-depth analysis detailing your home's value as well as a comparison with similar homes in the area
Home Values in the Area
Average Home Value in this Area
Purchase History
| Date | Buyer | Sale Price | Title Company |
|---|---|---|---|
| Nebeker Randy L | -- | Stewart Title Company | |
| Nebeker Christy L | -- | First American Ttl Richfield | |
| Nebeker Randy L | -- | First American Title Insuran | |
| Mackay Robin | -- | First American | |
| Turf Farms Inc | -- | None Available | |
| Tuft Farms Inc | -- | None Available |
Source: Public Records
Mortgage History
| Date | Status | Borrower | Loan Amount |
|---|---|---|---|
| Open | Nebeker Randy L | $53,000 | |
| Previous Owner | Nebeker Christy L | $320,000 |
Source: Public Records
Tax History Compared to Growth
Tax History
| Year | Tax Paid | Tax Assessment Tax Assessment Total Assessment is a certain percentage of the fair market value that is determined by local assessors to be the total taxable value of land and additions on the property. | Land | Improvement |
|---|---|---|---|---|
| 2024 | $2,995 | $327,005 | $36,790 | $290,215 |
| 2023 | $2,995 | $328,303 | $36,191 | $292,112 |
| 2022 | $2,615 | $247,802 | $28,571 | $219,231 |
| 2021 | $2,800 | $219,565 | $20,213 | $199,352 |
| 2020 | $2,518 | $185,003 | $19,250 | $165,753 |
| 2019 | $2,328 | $179,720 | $17,330 | $162,390 |
| 2018 | $2,410 | $165,470 | $15,400 | $150,070 |
| 2017 | $1,064 | $75,900 | $16,560 | $59,340 |
| 2016 | -- | $500 | $0 | $0 |
| 2015 | -- | $500 | $0 | $0 |
| 2014 | -- | $500 | $0 | $0 |
Source: Public Records
Map
Nearby Homes