Estimated Value: $223,090 - $286,000
3
Beds
1
Bath
1,120
Sq Ft
$221/Sq Ft
Est. Value
About This Home
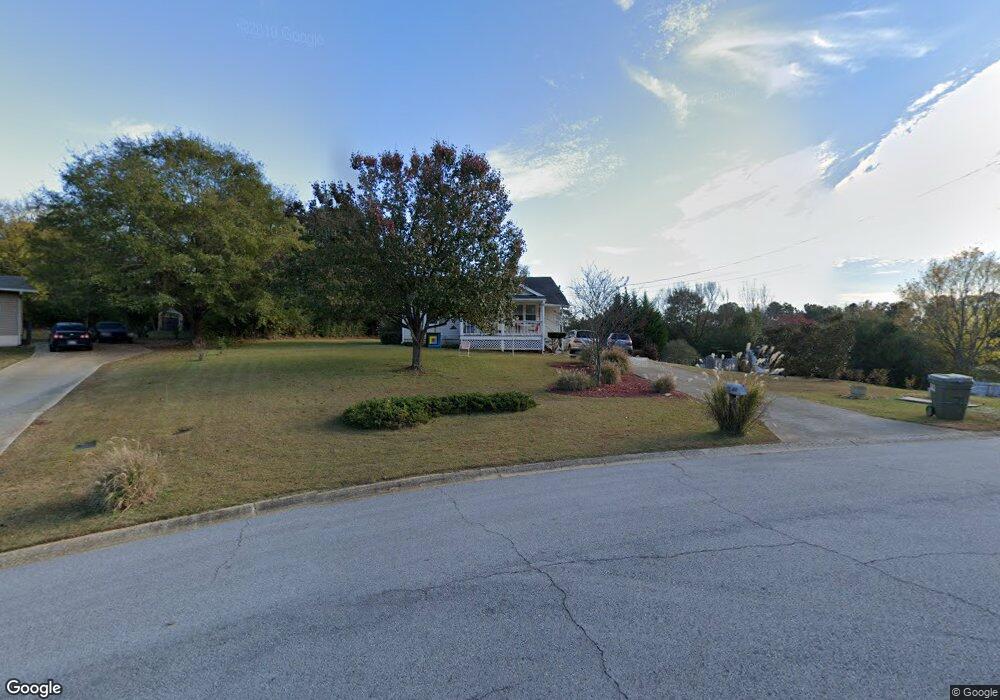
This home is located at 83 Nebo Dr, Hiram, GA 30141 and is currently estimated at $247,023, approximately $220 per square foot. 83 Nebo Dr is a home located in Paulding County with nearby schools including Sam D. Panter Elementary School, J. A. Dobbins Middle School, and Hiram High School.
Ownership History
Date
Name
Owned For
Owner Type
Purchase Details
Closed on
Sep 22, 2020
Sold by
Cobb Madelynn
Bought by
Cobb Madelynn and Spann Ricky
Current Estimated Value
Home Financials for this Owner
Home Financials are based on the most recent Mortgage that was taken out on this home.
Original Mortgage
$85,900
Outstanding Balance
$68,843
Interest Rate
2.9%
Mortgage Type
New Conventional
Estimated Equity
$178,180
Purchase Details
Closed on
Jun 30, 2006
Sold by
Flanigan Jana
Bought by
Cobb Madelynn
Home Financials for this Owner
Home Financials are based on the most recent Mortgage that was taken out on this home.
Original Mortgage
$94,900
Interest Rate
6.6%
Mortgage Type
New Conventional
Purchase Details
Closed on
Jan 5, 2006
Sold by
Durham James C
Bought by
Flanigan Jana
Home Financials for this Owner
Home Financials are based on the most recent Mortgage that was taken out on this home.
Original Mortgage
$57,938
Interest Rate
6.25%
Create a Home Valuation Report for This Property
The Home Valuation Report is an in-depth analysis detailing your home's value as well as a comparison with similar homes in the area
Home Values in the Area
Average Home Value in this Area
Purchase History
| Date | Buyer | Sale Price | Title Company |
|---|---|---|---|
| Cobb Madelynn | -- | -- | |
| Cobb Madelynn | $95,000 | -- | |
| Flanigan Jana | $57,000 | -- |
Source: Public Records
Mortgage History
| Date | Status | Borrower | Loan Amount |
|---|---|---|---|
| Open | Cobb Madelynn | $85,900 | |
| Previous Owner | Cobb Madelynn | $94,900 | |
| Previous Owner | Flanigan Jana | $57,938 |
Source: Public Records
Tax History Compared to Growth
Tax History
| Year | Tax Paid | Tax Assessment Tax Assessment Total Assessment is a certain percentage of the fair market value that is determined by local assessors to be the total taxable value of land and additions on the property. | Land | Improvement |
|---|---|---|---|---|
| 2024 | $453 | $71,520 | $12,000 | $59,520 |
| 2023 | $543 | $71,244 | $12,000 | $59,244 |
| 2022 | $681 | $46,728 | $12,000 | $34,728 |
| 2021 | $1,040 | $35,772 | $8,000 | $27,772 |
| 2020 | $986 | $33,212 | $8,000 | $25,212 |
| 2019 | $954 | $31,656 | $8,000 | $23,656 |
| 2018 | $656 | $21,764 | $8,000 | $13,764 |
| 2017 | $621 | $20,312 | $8,000 | $12,312 |
| 2016 | $574 | $18,992 | $8,000 | $10,992 |
| 2015 | $524 | $17,020 | $8,000 | $9,020 |
| 2014 | $548 | $17,360 | $8,000 | $9,360 |
| 2013 | -- | $14,600 | $8,000 | $6,600 |
Source: Public Records
Map
Nearby Homes
- 73 Riverstone Dr
- 14 Riverstone Dr
- 6 Creekside Bluff
- 56 Creekside Point
- 59 Creekside Bluff
- 333 Lake Swan Ct
- 333 Ct
- 179 Country Club Dr
- 19 Creekside View
- 75 Clay Ct
- 87 Country Club Ct
- 4970 Nebo Rd
- 35 Oakmont Pass
- 18 Hawk Dr
- 98 Davis Ct
- 122 Hale Mountain Ct
- 105 Pine Valley Ct Unit 1
- 496 Hughes Rd
- 254 Swan Dr
- 51 White Path Dr