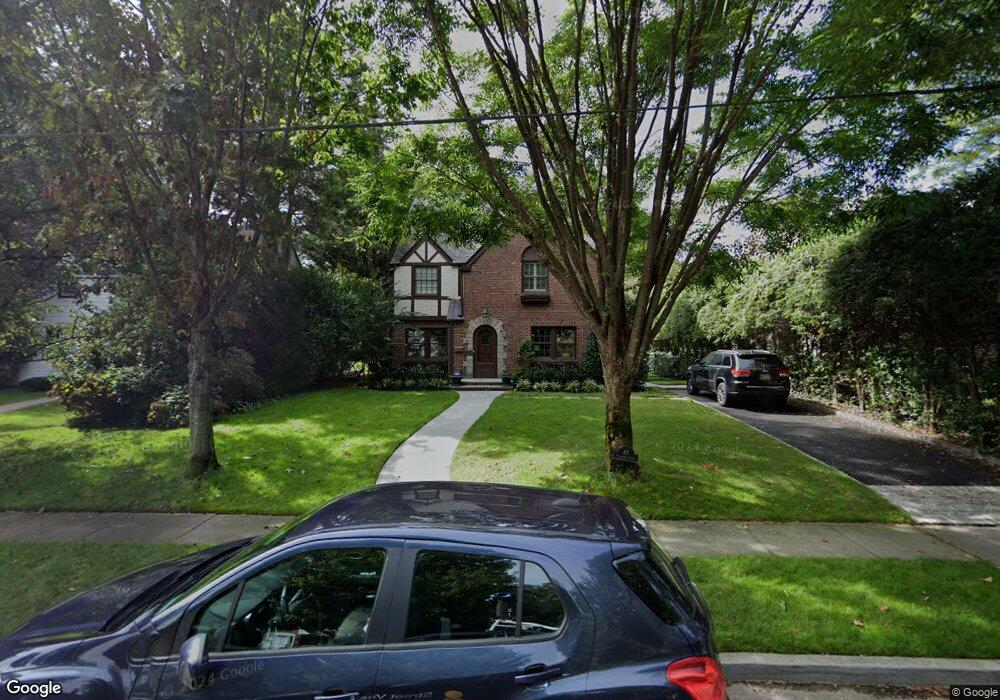
83 Plandome Ct Manhasset, NY 11030
Plandome Heights NeighborhoodEstimated Value: $2,318,854
--
Bed
4
Baths
2,712
Sq Ft
$855/Sq Ft
Est. Value
About This Home
This home is located at 83 Plandome Ct, Manhasset, NY 11030 and is currently estimated at $2,318,854, approximately $855 per square foot. 83 Plandome Ct is a home located in Nassau County with nearby schools including Manhasset Secondary School, St Mary's Elementary School, and Our Lady of Grace Montessori School.
Ownership History
Date
Name
Owned For
Owner Type
Purchase Details
Closed on
Jun 28, 2011
Sold by
Roszko Thomas E
Bought by
Roszko Sabrina C and Girard Matthew D
Current Estimated Value
Home Financials for this Owner
Home Financials are based on the most recent Mortgage that was taken out on this home.
Original Mortgage
$1,103,200
Outstanding Balance
$761,472
Interest Rate
4.58%
Mortgage Type
Purchase Money Mortgage
Estimated Equity
$1,557,382
Purchase Details
Closed on
Apr 1, 2004
Sold by
Lavin Sean
Bought by
Roszko Thomas
Purchase Details
Closed on
Jun 14, 2002
Sold by
Rowe Mary P
Bought by
Lavin Sean
Purchase Details
Closed on
Feb 9, 1995
Sold by
Gately Martin and Gately Mary
Bought by
Gately Martin and Gately Mary
Create a Home Valuation Report for This Property
The Home Valuation Report is an in-depth analysis detailing your home's value as well as a comparison with similar homes in the area
Home Values in the Area
Average Home Value in this Area
Purchase History
| Date | Buyer | Sale Price | Title Company |
|---|---|---|---|
| Roszko Sabrina C | $1,379,000 | -- | |
| Roszko Thomas | $1,300,100 | -- | |
| Lavin Sean | $915,000 | -- | |
| Gately Martin | -- | -- |
Source: Public Records
Mortgage History
| Date | Status | Borrower | Loan Amount |
|---|---|---|---|
| Open | Roszko Sabrina C | $1,103,200 |
Source: Public Records
Tax History Compared to Growth
Tax History
| Year | Tax Paid | Tax Assessment Tax Assessment Total Assessment is a certain percentage of the fair market value that is determined by local assessors to be the total taxable value of land and additions on the property. | Land | Improvement |
|---|---|---|---|---|
| 2025 | $19,714 | $1,296 | $602 | $694 |
| 2024 | $5,504 | $1,336 | $621 | $715 |
| 2023 | $22,353 | $1,610 | $748 | $862 |
| 2022 | $22,353 | $1,610 | $748 | $862 |
| 2021 | $21,694 | $1,608 | $747 | $861 |
| 2020 | $21,144 | $2,114 | $1,521 | $593 |
| 2019 | $19,232 | $2,265 | $1,350 | $915 |
| 2018 | $19,503 | $2,735 | $0 | $0 |
| 2017 | $14,962 | $2,735 | $1,630 | $1,105 |
| 2016 | $21,717 | $2,735 | $1,630 | $1,105 |
| 2015 | $6,430 | $2,735 | $1,489 | $1,246 |
| 2014 | $6,430 | $2,735 | $1,489 | $1,246 |
| 2013 | $6,131 | $2,735 | $1,630 | $1,105 |
Source: Public Records
Map
Nearby Homes
- 115 Shore Rd
- 15 Gaynor Ave Unit 2H
- 7 Shore Rd
- 1054 Plandome Rd
- 44 North Dr
- 17 Highland Terrace
- 90 Gaynor Ave
- 4 Kimson Ct
- 17 Pinewood Rd
- 1270 Plandome Rd
- 2 Stonytown Rd
- 63 Lake Rd
- 320 E Shore Rd Unit 10C
- 320 E Shore Rd Unit C
- 320 E Shore Rd Unit 25A
- 320 E Shore Rd Unit 11b
- 320 E Shore Rd Unit 2-A
- 42 Mora Ct
- 14 Combes Dr
- 300 Thompson Shore Rd
- 91 Plandome Ct
- 75 Plandome Ct
- 97 Plandome Ct
- 29 Plandome Ct
- 103 Plandome Ct
- 832 Plandome Rd
- 844 Plandome Rd
- 5 Plandome Ct
- 88 Plandome Ct
- 82 Plandome Ct
- 76 Plandome Ct
- 96 Plandome Ct
- 860 Plandome Rd
- 808 Plandome Rd
- 109 Plandome Ct
- 109 Plandome Ct Unit B
- 870 Plandome Rd
- 102 Plandome Ct
- 64 Plandome Ct
- 115 Plandome Ct