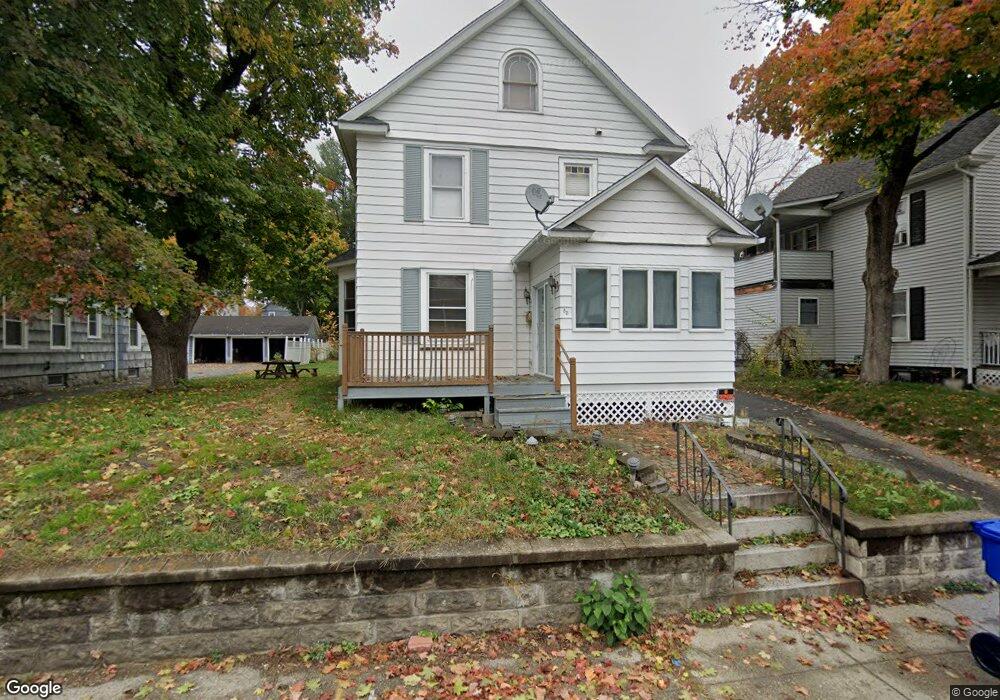
83 Pythian Ave Torrington, CT 06790
Estimated Value: $238,888 - $255,000
3
Beds
1
Bath
1,486
Sq Ft
$167/Sq Ft
Est. Value
About This Home
This home is located at 83 Pythian Ave, Torrington, CT 06790 and is currently estimated at $248,472, approximately $167 per square foot. 83 Pythian Ave is a home located in Litchfield County with nearby schools including Torrington Middle School, Torrington High School, and St. John Paul the Great Academy.
Ownership History
Date
Name
Owned For
Owner Type
Purchase Details
Closed on
Jun 24, 2010
Sold by
Davis Jason and Davis Shannon
Bought by
Knight Lois and Knight William
Current Estimated Value
Home Financials for this Owner
Home Financials are based on the most recent Mortgage that was taken out on this home.
Original Mortgage
$50,000
Interest Rate
4.98%
Purchase Details
Closed on
Jun 26, 2006
Sold by
Watson Richard N and Watson Cristeen S
Bought by
Davis Jason and Davis Shannon
Home Financials for this Owner
Home Financials are based on the most recent Mortgage that was taken out on this home.
Original Mortgage
$176,100
Interest Rate
6.59%
Purchase Details
Closed on
Dec 3, 2002
Sold by
Duchene Russell J and Duchene Agatha E
Bought by
Watson Cristeen S and Watson Richard N
Purchase Details
Closed on
Dec 30, 1992
Sold by
Farnham Philomene Est
Bought by
Duchene Russell J
Create a Home Valuation Report for This Property
The Home Valuation Report is an in-depth analysis detailing your home's value as well as a comparison with similar homes in the area
Home Values in the Area
Average Home Value in this Area
Purchase History
| Date | Buyer | Sale Price | Title Company |
|---|---|---|---|
| Knight Lois | $118,331 | -- | |
| Davis Jason | $177,500 | -- | |
| Watson Cristeen S | $147,500 | -- | |
| Duchene Russell J | $80,000 | -- |
Source: Public Records
Mortgage History
| Date | Status | Borrower | Loan Amount |
|---|---|---|---|
| Closed | Duchene Russell J | $50,000 | |
| Previous Owner | Duchene Russell J | $176,100 | |
| Previous Owner | Duchene Russell J | $11,200 |
Source: Public Records
Tax History Compared to Growth
Tax History
| Year | Tax Paid | Tax Assessment Tax Assessment Total Assessment is a certain percentage of the fair market value that is determined by local assessors to be the total taxable value of land and additions on the property. | Land | Improvement |
|---|---|---|---|---|
| 2025 | $5,402 | $140,490 | $20,370 | $120,120 |
| 2024 | $3,249 | $67,720 | $20,370 | $47,350 |
| 2023 | $3,248 | $67,720 | $20,370 | $47,350 |
| 2022 | $3,192 | $67,720 | $20,370 | $47,350 |
| 2021 | $3,127 | $67,720 | $20,370 | $47,350 |
| 2020 | $3,127 | $67,720 | $20,370 | $47,350 |
| 2019 | $3,256 | $70,530 | $20,370 | $50,160 |
| 2018 | $3,256 | $70,530 | $20,370 | $50,160 |
| 2017 | $3,227 | $70,530 | $20,370 | $50,160 |
| 2016 | $3,227 | $70,530 | $20,370 | $50,160 |
| 2015 | $3,227 | $70,530 | $20,370 | $50,160 |
| 2014 | $3,109 | $85,590 | $27,450 | $58,140 |
Source: Public Records
Map
Nearby Homes
- 00 Winthrop St & E Elm St
- 98 E Elm St
- 115 Margerie St
- 25 Margerie St
- 96 Edward Ave
- 10 Mckay St
- 483 Brightwood Ave
- 775 Main St
- 130 N Elm St
- 279 E Elm St
- 35 James St
- 839 Main St Unit 65
- 839 Main St Unit 12
- 839 Main St Unit 104
- 18 Tarlton St
- 279 Main St
- 90 Spruce Dr
- 118 Bannon St
- 118 Pearl St
- 291 E Main St
- 71 Pythian Ave
- 89 Pythian Ave
- 65 Pythian Ave
- 99 Pythian Ave
- 99 Pythian Ave Unit 2
- 82 Pythian Ave
- 82 Pythian Ave
- 82 Pythian Ave Unit 2
- 82 Pythian Ave Unit 1
- 86 Calhoun St
- 55 Pythian Ave
- 105 Pythian Ave
- 74 Calhoun St
- 92 Calhoun St
- 59 Pythian Ave 1st Flr
- 63 Pythian Ave
- 63 Pythian Ave Unit 1
- 57 Pythian Ave 2nd Flr
- 57 Pythian Ave
- 68 Calhoun St