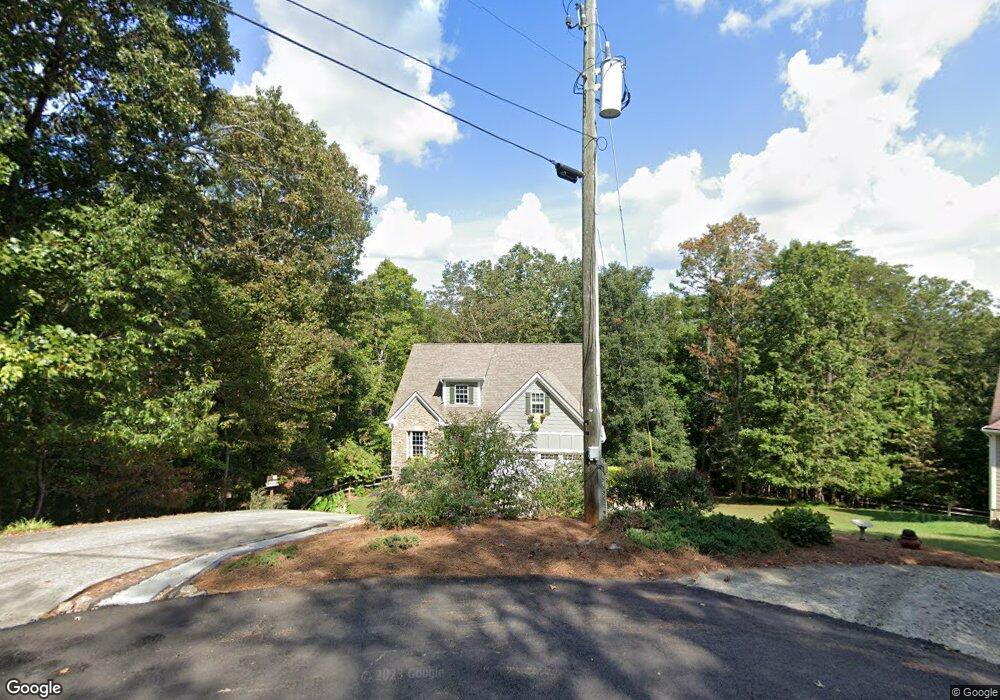
83 Shamans Way Dahlonega, GA 30533
Estimated Value: $398,809 - $520,000
--
Bed
3
Baths
1,718
Sq Ft
$277/Sq Ft
Est. Value
About This Home
This home is located at 83 Shamans Way, Dahlonega, GA 30533 and is currently estimated at $475,702, approximately $276 per square foot. 83 Shamans Way is a home located in Lumpkin County with nearby schools including Clay County Middle School and Lumpkin County High School.
Ownership History
Date
Name
Owned For
Owner Type
Purchase Details
Closed on
Feb 15, 2007
Sold by
Not Provided
Bought by
Jenkins Margaret Baker
Current Estimated Value
Purchase Details
Closed on
Mar 20, 2006
Sold by
Not Provided
Bought by
Jenkins Margaret Baker
Home Financials for this Owner
Home Financials are based on the most recent Mortgage that was taken out on this home.
Original Mortgage
$38,860
Interest Rate
6.04%
Mortgage Type
New Conventional
Purchase Details
Closed on
Feb 17, 2006
Sold by
Not Provided
Bought by
Jenkins Margaret Baker
Home Financials for this Owner
Home Financials are based on the most recent Mortgage that was taken out on this home.
Original Mortgage
$38,860
Interest Rate
6.04%
Mortgage Type
New Conventional
Purchase Details
Closed on
Sep 1, 1987
Sold by
Hobson Anthony
Bought by
Hardman Bill T
Purchase Details
Closed on
Jul 1, 1984
Bought by
Hobson Anthony
Create a Home Valuation Report for This Property
The Home Valuation Report is an in-depth analysis detailing your home's value as well as a comparison with similar homes in the area
Home Values in the Area
Average Home Value in this Area
Purchase History
| Date | Buyer | Sale Price | Title Company |
|---|---|---|---|
| Jenkins Margaret Baker | $225,000 | -- | |
| Jenkins Margaret Baker | -- | -- | |
| Jenkins Margaret Baker | $45,000 | -- | |
| Hardman Bill T | -- | -- | |
| Hobson Anthony | -- | -- |
Source: Public Records
Mortgage History
| Date | Status | Borrower | Loan Amount |
|---|---|---|---|
| Previous Owner | Jenkins Margaret Baker | $38,860 |
Source: Public Records
Tax History Compared to Growth
Tax History
| Year | Tax Paid | Tax Assessment Tax Assessment Total Assessment is a certain percentage of the fair market value that is determined by local assessors to be the total taxable value of land and additions on the property. | Land | Improvement |
|---|---|---|---|---|
| 2024 | $1,137 | $147,429 | $16,000 | $131,429 |
| 2023 | $776 | $138,677 | $16,000 | $122,677 |
| 2022 | $917 | $123,601 | $16,000 | $107,601 |
| 2021 | $577 | $99,223 | $10,000 | $89,223 |
| 2020 | $556 | $96,752 | $10,000 | $86,752 |
| 2019 | $634 | $100,752 | $14,000 | $86,752 |
| 2018 | $481 | $89,951 | $14,000 | $75,951 |
| 2017 | $409 | $85,663 | $14,000 | $71,663 |
| 2016 | $294 | $79,424 | $14,000 | $65,424 |
| 2015 | $227 | $79,424 | $14,000 | $65,424 |
| 2014 | $227 | $80,128 | $14,000 | $66,128 |
| 2013 | -- | $80,830 | $14,000 | $66,830 |
Source: Public Records
Map
Nearby Homes
- 1415 Calhoun Rd
- 1170 Calhoun Rd
- 567 Crown Mountain Way
- 934 Golden Ave
- 99 Madeline Anthony Road Lots 44 and 45
- 99 Madeline Anthony Rd
- 490 Golden Ave
- 747 Golden Ave
- Lot 20 Crown Mountain Way
- 0 Crown Mountain Way Unit 7666031
- LOT 13 Crown Mountain Way
- Lot 28 Crown Mountain Way
- Lot 30 Crown Mountain Way
- 735 Calhoun Rd
- 0 Crown Mountain Unit 7682225
- 0 Crown Mountain Unit 10644759
- 0 Deer Run Unit 10437845
- 0 Alicia Ln
- 0 Calhoun Rd Unit 7643314
- 0 Calhoun Rd Unit 10598012
- 86 Shamans Way
- 15 Shamans Way
- 43 Shamans Way
- 0 Shamans Way
- 60 Shamans Way
- 334 Doyiyi Valley Rd
- 334 Dohiyi Valley Rd
- 1235 Calhoun Rd
- Lot 34 Calhoun Ln
- 1355 Calhoun Rd
- 1230 Calhoun Rd
- 452 Dohiyi Valley Rd
- 1270 Calhoun Rd
- 6 Calhoun Rd
- 1224 Calhoun Rd
- 29 Windsong Way
- 1414 Calhoun Rd
- 1426 Calhoun Rd
- 1370 Calhoun Rd
- 1089 Calhoun Rd