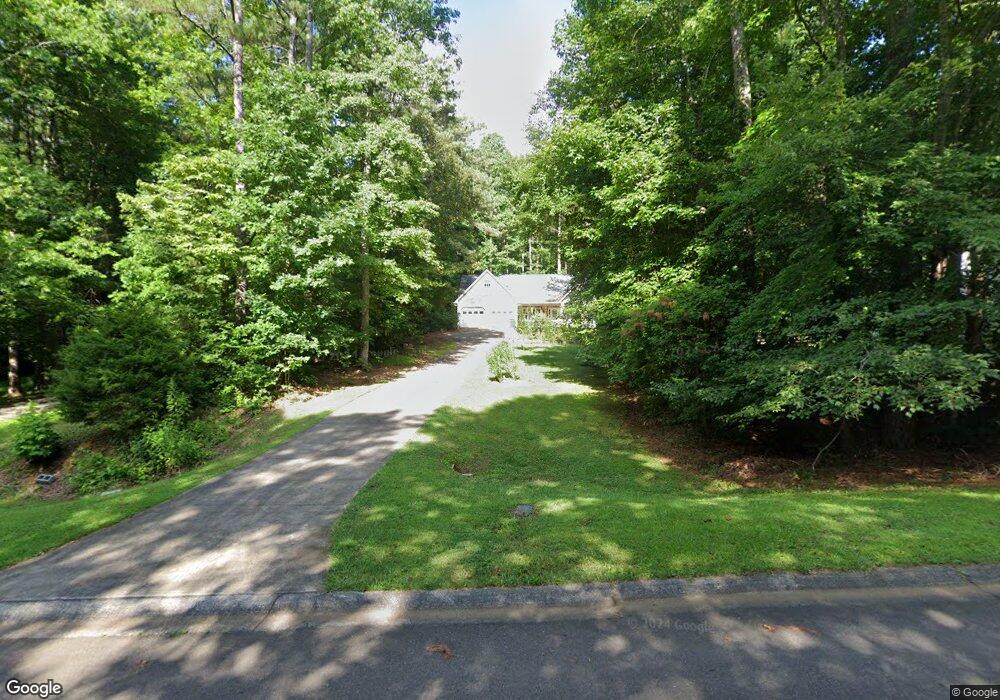
83 Spring Place Dr Jasper, GA 30143
Estimated Value: $337,000 - $474,000
3
Beds
2
Baths
1,495
Sq Ft
$263/Sq Ft
Est. Value
About This Home
This home is located at 83 Spring Place Dr, Jasper, GA 30143 and is currently estimated at $392,552, approximately $262 per square foot. 83 Spring Place Dr is a home located in Pickens County with nearby schools including Harmony Elementary School, Pickens County Middle School, and Pickens County High School.
Ownership History
Date
Name
Owned For
Owner Type
Purchase Details
Closed on
Jun 4, 2010
Sold by
Household Realty Corp
Bought by
Harriss Karen V
Current Estimated Value
Home Financials for this Owner
Home Financials are based on the most recent Mortgage that was taken out on this home.
Original Mortgage
$106,400
Outstanding Balance
$66,430
Interest Rate
3.62%
Mortgage Type
New Conventional
Estimated Equity
$326,122
Purchase Details
Closed on
Mar 5, 2004
Sold by
Deming Steven M
Bought by
Faix James M
Purchase Details
Closed on
Jan 17, 2002
Sold by
Branch Ginger
Bought by
Deming Steven M
Purchase Details
Closed on
Mar 28, 2000
Sold by
Denson J L
Bought by
Branch Ginger
Create a Home Valuation Report for This Property
The Home Valuation Report is an in-depth analysis detailing your home's value as well as a comparison with similar homes in the area
Home Values in the Area
Average Home Value in this Area
Purchase History
| Date | Buyer | Sale Price | Title Company |
|---|---|---|---|
| Harriss Karen V | $133,000 | -- | |
| Faix James M | $29,000 | -- | |
| Deming Steven M | $28,500 | -- | |
| Branch Ginger | $28,000 | -- |
Source: Public Records
Mortgage History
| Date | Status | Borrower | Loan Amount |
|---|---|---|---|
| Open | Harriss Karen V | $106,400 |
Source: Public Records
Tax History Compared to Growth
Tax History
| Year | Tax Paid | Tax Assessment Tax Assessment Total Assessment is a certain percentage of the fair market value that is determined by local assessors to be the total taxable value of land and additions on the property. | Land | Improvement |
|---|---|---|---|---|
| 2024 | $2,171 | $114,684 | $18,000 | $96,684 |
| 2023 | $2,231 | $114,684 | $18,000 | $96,684 |
| 2022 | $1,640 | $85,650 | $18,000 | $67,650 |
| 2021 | $1,067 | $53,991 | $10,000 | $43,991 |
| 2020 | $1,100 | $53,991 | $10,000 | $43,991 |
| 2019 | $1,125 | $53,991 | $10,000 | $43,991 |
| 2018 | $1,135 | $53,991 | $10,000 | $43,991 |
| 2017 | $1,154 | $53,991 | $10,000 | $43,991 |
| 2016 | $1,172 | $53,991 | $10,000 | $43,991 |
| 2015 | $1,145 | $53,991 | $10,000 | $43,991 |
| 2014 | $1,148 | $53,991 | $10,000 | $43,991 |
| 2013 | -- | $53,990 | $10,000 | $43,990 |
Source: Public Records
Map
Nearby Homes
- 275 Beth Ave
- 244 Town Creek Trail
- 0 Hickory Trail Unit 10593185
- 0 Hickory Trail Unit 405391
- 960 S Main St
- 71 Emerald Ln
- 8266 Cox Mountain Dr
- 60 Mcwhorter St
- 5 Towne Villas Dr
- 59 Brittany Ct
- 59 Brittany Ct Unit 8
- 72 W Sellers St
- 165 Towne Villas Dr Unit 20
- 157 Towne Villas Dr Unit 18
- 147 Elizabeth St
- 0 Mulberry Cir Unit 7660881
- 5566 Red Fox Ln
- 280 Vistaview Pkwy
- 0 Lower Sassafras Pkwy Unit 24570415
- 321 Owls Brow
- 65 Spring Place Dr
- 113 Spring Place Dr
- 80 Spring Place Dr
- 79 Wood St
- 20 Spring Place Dr
- 0 Wood St
- 0 Spring Place Dr Unit 3180682
- 0 Spring Place Dr Unit 8150060
- 0 Spring Place Dr
- 151 Wood St
- 1682 Camp Rd
- 171 Wood St
- 920 Wood St
- 92 Wood St
- 1492 Camp Rd
- 185 Wood St
- 281 Little Ave
- 1812 Camp Rd
- 345 Little Ave
- 371 Little Ave