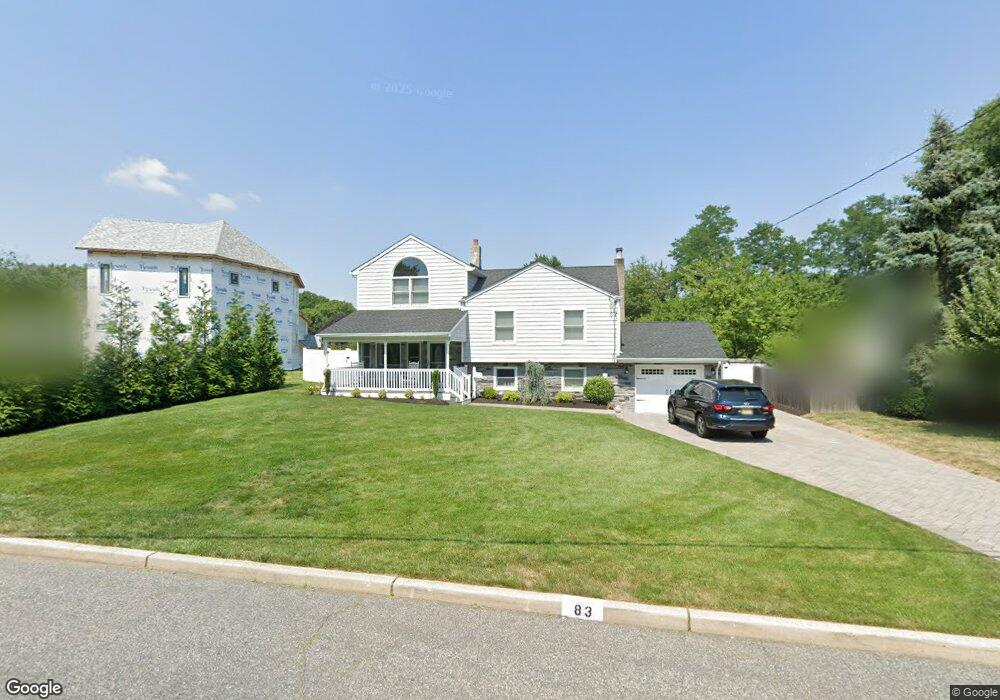
83 Truex Place Middletown, NJ 07748
New Monmouth NeighborhoodEstimated Value: $775,000 - $999,000
4
Beds
3
Baths
2,596
Sq Ft
$332/Sq Ft
Est. Value
About This Home
This home is located at 83 Truex Place, Middletown, NJ 07748 and is currently estimated at $861,607, approximately $331 per square foot. 83 Truex Place is a home located in Monmouth County with nearby schools including New Monmouth Elementary School, Thorne Middle School, and Middletown High School North.
Ownership History
Date
Name
Owned For
Owner Type
Purchase Details
Closed on
Apr 15, 2013
Sold by
Molinaro Frank A and Molinaro Michele D
Bought by
Monigan Jonathan T and Trezza Erin P
Current Estimated Value
Home Financials for this Owner
Home Financials are based on the most recent Mortgage that was taken out on this home.
Original Mortgage
$307,200
Outstanding Balance
$62,386
Interest Rate
2.77%
Mortgage Type
New Conventional
Estimated Equity
$799,221
Create a Home Valuation Report for This Property
The Home Valuation Report is an in-depth analysis detailing your home's value as well as a comparison with similar homes in the area
Home Values in the Area
Average Home Value in this Area
Purchase History
| Date | Buyer | Sale Price | Title Company |
|---|---|---|---|
| Monigan Jonathan T | $384,000 | None Available |
Source: Public Records
Mortgage History
| Date | Status | Borrower | Loan Amount |
|---|---|---|---|
| Open | Monigan Jonathan T | $307,200 |
Source: Public Records
Tax History Compared to Growth
Tax History
| Year | Tax Paid | Tax Assessment Tax Assessment Total Assessment is a certain percentage of the fair market value that is determined by local assessors to be the total taxable value of land and additions on the property. | Land | Improvement |
|---|---|---|---|---|
| 2025 | $10,661 | $698,100 | $390,600 | $307,500 |
| 2024 | $9,118 | $648,100 | $346,300 | $301,800 |
| 2023 | $9,118 | $524,600 | $286,600 | $238,000 |
| 2022 | $8,755 | $466,000 | $239,400 | $226,600 |
| 2021 | $8,755 | $420,900 | $206,200 | $214,700 |
| 2020 | $8,400 | $392,900 | $192,500 | $200,400 |
| 2019 | $8,228 | $389,600 | $192,500 | $197,100 |
| 2018 | $8,007 | $369,500 | $181,600 | $187,900 |
| 2017 | $7,689 | $362,000 | $181,600 | $180,400 |
| 2016 | $7,618 | $357,500 | $181,600 | $175,900 |
| 2015 | $7,623 | $356,900 | $181,600 | $175,300 |
| 2014 | $7,482 | $341,800 | $181,600 | $160,200 |
Source: Public Records
Map
Nearby Homes