Estimated Value: $250,000 - $330,000
3
Beds
1
Bath
1,146
Sq Ft
$243/Sq Ft
Est. Value
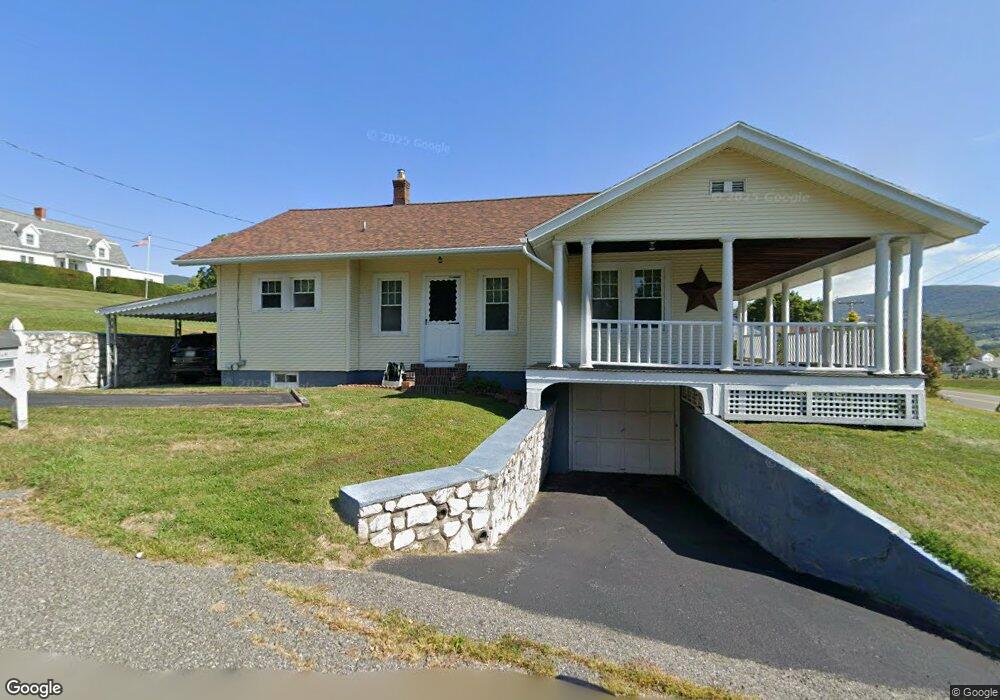
About This Home
This home is located at 83 W Maple St, Adams, MA 01220 and is currently estimated at $278,943, approximately $243 per square foot. 83 W Maple St is a home located in Berkshire County with nearby schools including Hoosac Valley Middle & High School, Berkshire Arts & Technology Charter Public School, and St. Stanislaus Kostka School.
Ownership History
Date
Name
Owned For
Owner Type
Purchase Details
Closed on
Jan 5, 1989
Sold by
Starwarz Paul
Bought by
Weeden Arthur J
Current Estimated Value
Home Financials for this Owner
Home Financials are based on the most recent Mortgage that was taken out on this home.
Original Mortgage
$101,700
Interest Rate
10.32%
Mortgage Type
Purchase Money Mortgage
Create a Home Valuation Report for This Property
The Home Valuation Report is an in-depth analysis detailing your home's value as well as a comparison with similar homes in the area
Home Values in the Area
Average Home Value in this Area
Purchase History
| Date | Buyer | Sale Price | Title Company |
|---|---|---|---|
| Weeden Arthur J | $107,500 | -- |
Source: Public Records
Mortgage History
| Date | Status | Borrower | Loan Amount |
|---|---|---|---|
| Open | Weeden Arthur J | $15,000 | |
| Open | Weeden Arthur J | $105,300 | |
| Closed | Weeden Arthur J | $15,443 | |
| Closed | Weeden Arthur J | $101,700 |
Source: Public Records
Tax History
| Year | Tax Paid | Tax Assessment Tax Assessment Total Assessment is a certain percentage of the fair market value that is determined by local assessors to be the total taxable value of land and additions on the property. | Land | Improvement |
|---|---|---|---|---|
| 2025 | $3,875 | $227,800 | $55,600 | $172,200 |
| 2024 | $3,654 | $208,300 | $52,300 | $156,000 |
| 2023 | $3,384 | $182,400 | $47,500 | $134,900 |
| 2022 | $3,292 | $157,600 | $41,300 | $116,300 |
| 2021 | $3,228 | $142,700 | $41,300 | $101,400 |
| 2020 | $3,135 | $143,300 | $41,900 | $101,400 |
| 2019 | $3,065 | $143,300 | $41,900 | $101,400 |
| 2018 | $3,140 | $141,400 | $41,900 | $99,500 |
| 2017 | $3,022 | $141,400 | $41,900 | $99,500 |
| 2016 | $2,926 | $136,800 | $41,900 | $94,900 |
| 2015 | $2,864 | $134,000 | $43,800 | $90,200 |
| 2014 | $2,673 | $134,000 | $43,800 | $90,200 |
Source: Public Records
Map
Nearby Homes
Your Personal Tour Guide
Ask me questions while you tour the home.