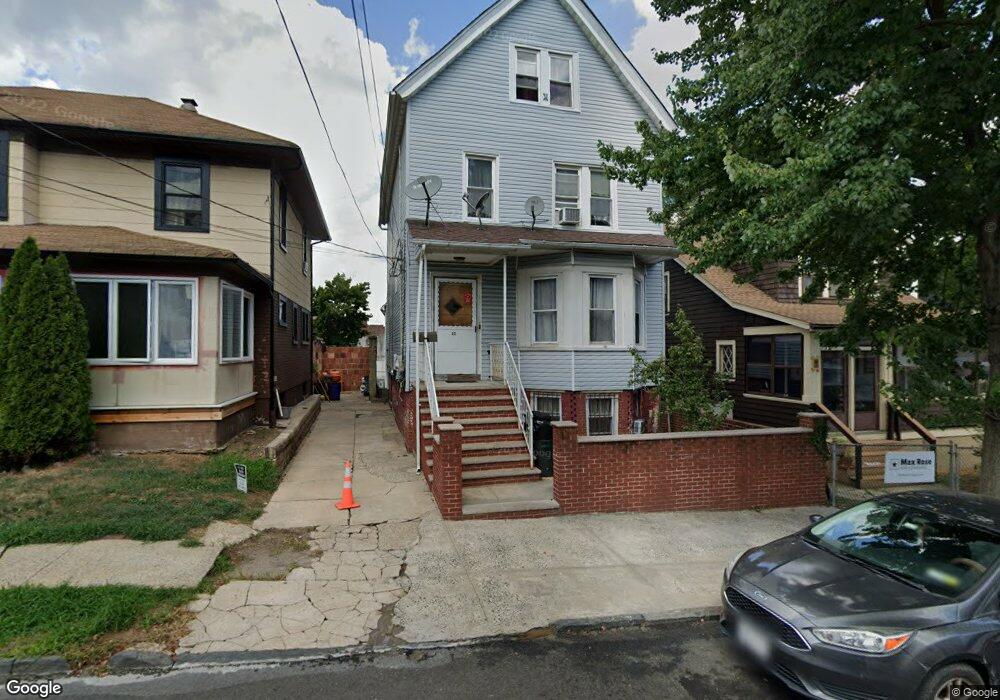
83 Wave St Staten Island, NY 10304
Stapleton NeighborhoodEstimated Value: $737,952 - $792,000
--
Bed
--
Bath
2,114
Sq Ft
$360/Sq Ft
Est. Value
About This Home
This home is located at 83 Wave St, Staten Island, NY 10304 and is currently estimated at $761,238, approximately $360 per square foot. 83 Wave St is a home located in Richmond County with nearby schools including P.S. 16 John J Driscoll, P.S. 74 Future Leaders Elementary School, and Fort Hill Collaborative Elementary.
Ownership History
Date
Name
Owned For
Owner Type
Purchase Details
Closed on
Aug 29, 2013
Sold by
Afonja Paul O and Afonja Francisca A
Bought by
Afonja Paul O and Afonja Francisca A
Current Estimated Value
Home Financials for this Owner
Home Financials are based on the most recent Mortgage that was taken out on this home.
Original Mortgage
$150,000
Outstanding Balance
$38,435
Interest Rate
4.43%
Mortgage Type
New Conventional
Estimated Equity
$722,803
Purchase Details
Closed on
Aug 8, 1994
Sold by
Grimes John F and Caines Lillian
Bought by
Afonja Paul O and Afonja Francisca A
Home Financials for this Owner
Home Financials are based on the most recent Mortgage that was taken out on this home.
Original Mortgage
$76,500
Interest Rate
8.61%
Create a Home Valuation Report for This Property
The Home Valuation Report is an in-depth analysis detailing your home's value as well as a comparison with similar homes in the area
Home Values in the Area
Average Home Value in this Area
Purchase History
| Date | Buyer | Sale Price | Title Company |
|---|---|---|---|
| Afonja Paul O | -- | None Available | |
| Afonja Paul O | $85,000 | -- |
Source: Public Records
Mortgage History
| Date | Status | Borrower | Loan Amount |
|---|---|---|---|
| Open | Afonja Paul O | $150,000 | |
| Previous Owner | Afonja Paul O | $76,500 |
Source: Public Records
Tax History Compared to Growth
Tax History
| Year | Tax Paid | Tax Assessment Tax Assessment Total Assessment is a certain percentage of the fair market value that is determined by local assessors to be the total taxable value of land and additions on the property. | Land | Improvement |
|---|---|---|---|---|
| 2025 | $4,209 | $34,980 | $3,737 | $31,243 |
| 2024 | $4,221 | $37,320 | $3,307 | $34,013 |
| 2023 | $4,256 | $22,356 | $3,265 | $19,091 |
| 2022 | $1,968 | $36,600 | $5,520 | $31,080 |
| 2021 | $4,099 | $30,300 | $5,520 | $24,780 |
| 2020 | $1,710 | $33,480 | $5,520 | $27,960 |
| 2019 | $1,433 | $32,520 | $5,520 | $27,000 |
| 2018 | $3,500 | $18,630 | $3,702 | $14,928 |
| 2017 | $3,467 | $18,476 | $4,249 | $14,227 |
| 2016 | $3,175 | $17,431 | $5,381 | $12,050 |
| 2015 | $2,674 | $16,446 | $4,179 | $12,267 |
| 2014 | $2,674 | $15,525 | $3,971 | $11,554 |
Source: Public Records
Map
Nearby Homes