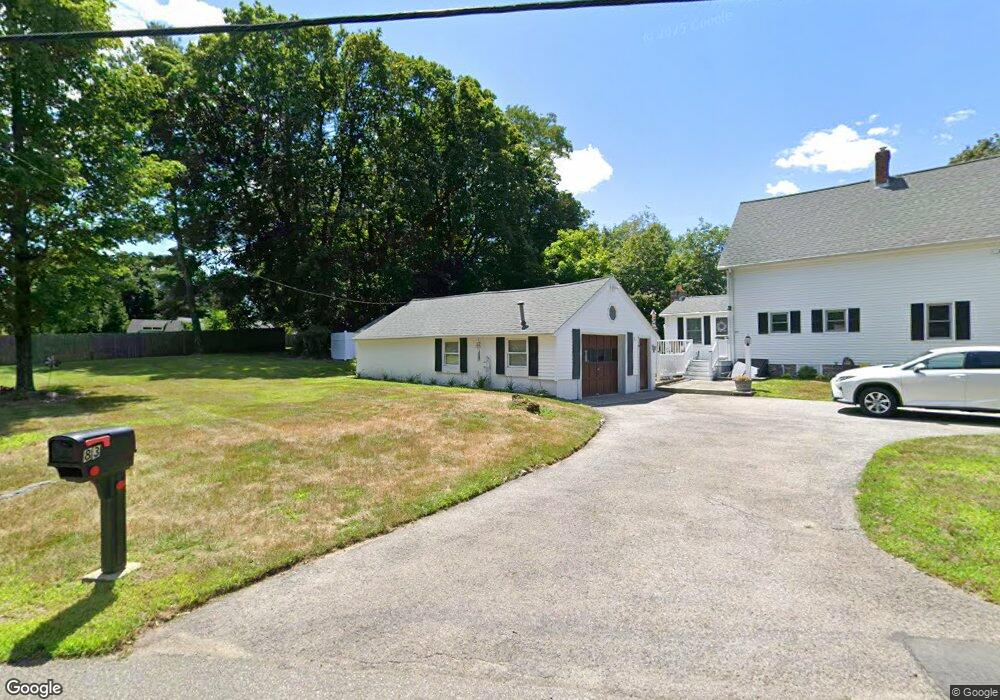
83 Whipple Rd Tewksbury, MA 01876
Estimated Value: $541,000 - $651,000
3
Beds
1
Bath
1,128
Sq Ft
$516/Sq Ft
Est. Value
About This Home
This home is located at 83 Whipple Rd, Tewksbury, MA 01876 and is currently estimated at $582,231, approximately $516 per square foot. 83 Whipple Rd is a home located in Middlesex County with nearby schools including John F. Ryan Elementary School, John W. Wynn Middle School, and Tewksbury Memorial High School.
Ownership History
Date
Name
Owned For
Owner Type
Purchase Details
Closed on
Oct 30, 2019
Sold by
Raposa Michelle C and Waseem Elbegearmi A
Bought by
Raposa Michael and Raposa Nancy
Current Estimated Value
Purchase Details
Closed on
Aug 21, 2009
Sold by
Kasarjian John
Bought by
Raposa Michelle C and Waseem El-Begearmi A
Home Financials for this Owner
Home Financials are based on the most recent Mortgage that was taken out on this home.
Original Mortgage
$201,286
Interest Rate
5.19%
Mortgage Type
Purchase Money Mortgage
Purchase Details
Closed on
Mar 17, 2006
Sold by
Kasarjian Corinne N
Bought by
Kasarjian John
Purchase Details
Closed on
Nov 30, 1994
Sold by
Kin Jonathan and King Pamela
Bought by
Reynolds James and Reynolds Kathleen
Purchase Details
Closed on
Nov 25, 1987
Sold by
Cooper Gerald
Bought by
King Jonathan
Create a Home Valuation Report for This Property
The Home Valuation Report is an in-depth analysis detailing your home's value as well as a comparison with similar homes in the area
Home Values in the Area
Average Home Value in this Area
Purchase History
| Date | Buyer | Sale Price | Title Company |
|---|---|---|---|
| Raposa Michael | $320,000 | -- | |
| Raposa Michael | $320,000 | -- | |
| Raposa Michelle C | $205,000 | -- | |
| Raposa Michelle C | $205,000 | -- | |
| Kasarjian John | -- | -- | |
| Kasarjian John | -- | -- | |
| Reynolds James | $140,000 | -- | |
| Reynolds James | $140,000 | -- | |
| King Jonathan | $137,000 | -- |
Source: Public Records
Mortgage History
| Date | Status | Borrower | Loan Amount |
|---|---|---|---|
| Previous Owner | King Jonathan | $195,400 | |
| Previous Owner | Raposa Michelle C | $201,286 |
Source: Public Records
Tax History Compared to Growth
Tax History
| Year | Tax Paid | Tax Assessment Tax Assessment Total Assessment is a certain percentage of the fair market value that is determined by local assessors to be the total taxable value of land and additions on the property. | Land | Improvement |
|---|---|---|---|---|
| 2025 | $6,347 | $480,100 | $275,900 | $204,200 |
| 2024 | $6,192 | $462,400 | $262,700 | $199,700 |
| 2023 | $5,919 | $419,800 | $238,700 | $181,100 |
| 2022 | $5,793 | $381,100 | $207,600 | $173,500 |
| 2021 | $6,782 | $359,200 | $188,800 | $170,400 |
| 2020 | $5,476 | $342,900 | $179,800 | $163,100 |
| 2019 | $4,971 | $313,800 | $171,200 | $142,600 |
| 2018 | $4,491 | $278,400 | $171,200 | $107,200 |
| 2017 | $4,513 | $276,700 | $171,200 | $105,500 |
| 2016 | $4,382 | $268,000 | $171,200 | $96,800 |
| 2015 | $4,091 | $249,900 | $166,000 | $83,900 |
| 2014 | $3,878 | $240,700 | $166,000 | $74,700 |
Source: Public Records
Map
Nearby Homes
- 347 Astle St
- 43 Oak Knoll Rd
- 357 Boylston St Unit 2
- 82 Boylston Ln Unit 16
- 10 Babicz Rd
- 50 Arnold Ave
- 32 Rockingham St Unit A
- 90 Roper St Unit G
- 45 Woburn St
- 55 Stratham St
- 157 Billerica St
- 10 Mission Place
- 1081 Lawrence St
- 1508 Gorham St Unit 101
- 1514 Gorham St Unit 5
- 1514 Gorham St Unit 4
- 1514 Gorham St Unit 3
- 1514 Gorham St Unit 2
- 1514 Gorham St Unit 1
- 71 Secor Way