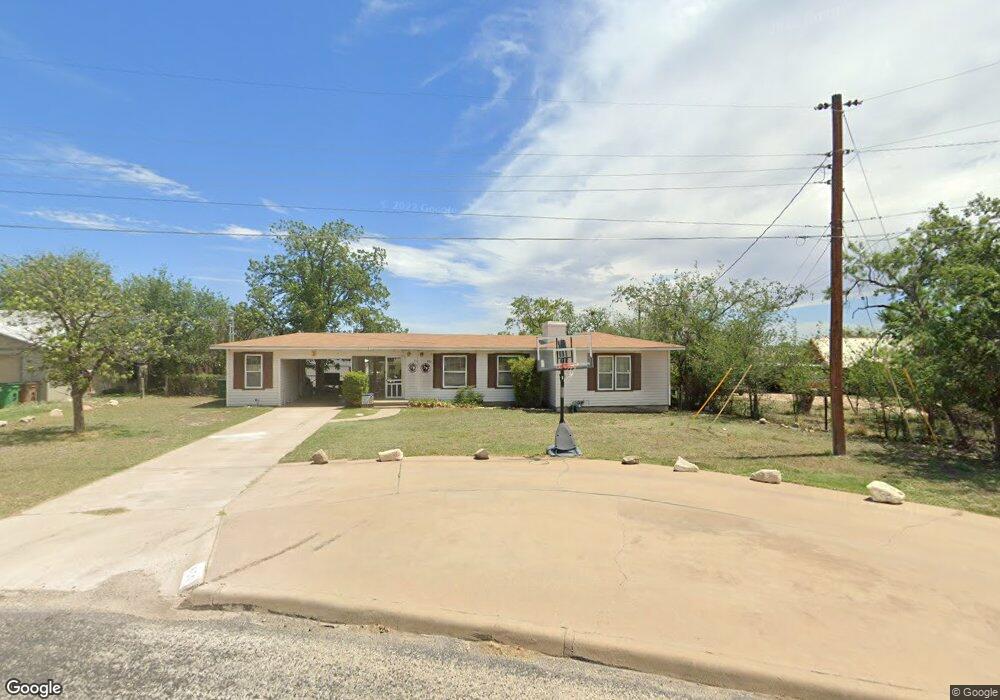
830 Baker St San Angelo, TX 76903
Fort Concho NeighborhoodEstimated Value: $145,000 - $169,000
3
Beds
2
Baths
1,601
Sq Ft
$100/Sq Ft
Est. Value
About This Home
This home is located at 830 Baker St, San Angelo, TX 76903 and is currently estimated at $159,603, approximately $99 per square foot. 830 Baker St is a home located in Tom Green County with nearby schools including Ft. Concho Elementary School, Glenn Middle School, and Central High School.
Ownership History
Date
Name
Owned For
Owner Type
Purchase Details
Closed on
Sep 29, 2008
Sold by
Robertson David W
Bought by
Shelton Jerry S
Current Estimated Value
Home Financials for this Owner
Home Financials are based on the most recent Mortgage that was taken out on this home.
Original Mortgage
$78,155
Outstanding Balance
$51,984
Interest Rate
6.52%
Mortgage Type
Purchase Money Mortgage
Estimated Equity
$107,619
Purchase Details
Closed on
May 31, 2002
Sold by
Edwards James W
Bought by
Shelton Jerry S
Create a Home Valuation Report for This Property
The Home Valuation Report is an in-depth analysis detailing your home's value as well as a comparison with similar homes in the area
Home Values in the Area
Average Home Value in this Area
Purchase History
| Date | Buyer | Sale Price | Title Company |
|---|---|---|---|
| Shelton Jerry S | -- | None Available | |
| Shelton Jerry S | -- | -- |
Source: Public Records
Mortgage History
| Date | Status | Borrower | Loan Amount |
|---|---|---|---|
| Open | Shelton Jerry S | $78,155 |
Source: Public Records
Tax History
| Year | Tax Paid | Tax Assessment Tax Assessment Total Assessment is a certain percentage of the fair market value that is determined by local assessors to be the total taxable value of land and additions on the property. | Land | Improvement |
|---|---|---|---|---|
| 2025 | $1,366 | $145,420 | $64,830 | $80,590 |
| 2024 | $1,124 | $125,420 | $64,830 | $60,590 |
| 2023 | $948 | $151,500 | $88,420 | $63,080 |
| 2022 | $2,022 | $115,470 | $30,980 | $84,490 |
| 2021 | $2,011 | $82,940 | $0 | $0 |
| 2020 | $2,038 | $82,940 | $9,000 | $73,940 |
| 2019 | $2,099 | $82,940 | $9,000 | $73,940 |
| 2018 | $2,113 | $83,830 | $9,000 | $74,830 |
| 2017 | $2,065 | $82,320 | $9,000 | $73,320 |
| 2016 | $2,065 | $82,320 | $9,000 | $73,320 |
| 2015 | $1,424 | $82,320 | $9,000 | $73,320 |
| 2014 | $1,411 | $73,400 | $9,000 | $64,400 |
| 2013 | $1,265 | $63,200 | $0 | $0 |
Source: Public Records
Map
Nearby Homes
- 626 Parsons St
- 621 & 625 Powell St
- 611 E Avenue D
- 618 E Highland Blvd
- 513 Powell St
- 601 Rio Concho Dr
- 911 Todd Ln
- 211 S Buchanan St
- 210 S Baze St
- 206 S Baze St
- 105 W Riverside Ave
- 123 S Baze St
- 110 Estella Dr
- 309 E Highland Blvd
- 116 Van Zandt St
- 512 Wanda St
- 82 Belaire Ave
- 1517 Culberson St
- 145 Van Zandt St
- 1417 Coke St
Your Personal Tour Guide
Ask me questions while you tour the home.