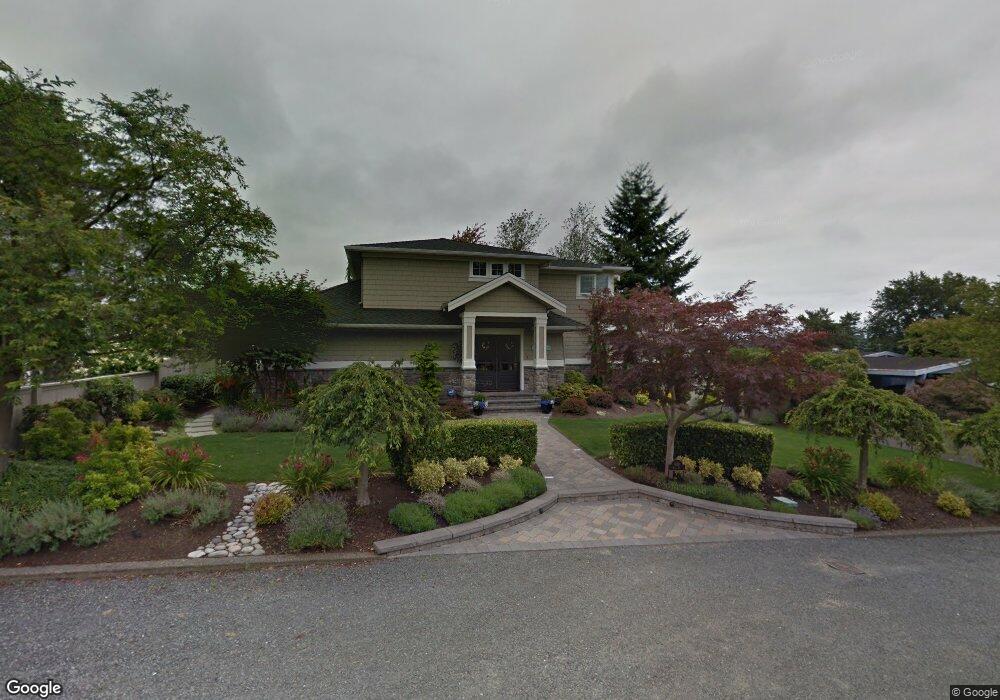
830 Bell St Edmonds, WA 98020
Edmonds Bowl NeighborhoodEstimated Value: $1,807,000 - $2,367,000
3
Beds
3
Baths
3,404
Sq Ft
$628/Sq Ft
Est. Value
About This Home
This home is located at 830 Bell St, Edmonds, WA 98020 and is currently estimated at $2,136,505, approximately $627 per square foot. 830 Bell St is a home located in Snohomish County with nearby schools including Edmonds Elementary School, College Place Middle School, and Edmonds-Woodway High School.
Ownership History
Date
Name
Owned For
Owner Type
Purchase Details
Closed on
Sep 10, 2010
Sold by
Carpenter Larry Scott
Bought by
Carpenter Larry Scott and Carpenter Wendy B
Current Estimated Value
Purchase Details
Closed on
Aug 24, 1995
Sold by
Walker Eleanore F and Hartman Joseph T
Bought by
Carpenter Larry Scott
Home Financials for this Owner
Home Financials are based on the most recent Mortgage that was taken out on this home.
Original Mortgage
$296,000
Interest Rate
7.5%
Purchase Details
Closed on
Jul 22, 1995
Sold by
Boothman Kent P and Boothman Verna M
Bought by
Walker Eleanore F and Hartman Joseph T
Home Financials for this Owner
Home Financials are based on the most recent Mortgage that was taken out on this home.
Original Mortgage
$296,000
Interest Rate
7.5%
Purchase Details
Closed on
Mar 25, 1994
Sold by
Johnson Michael C
Bought by
Boothman Kent P and Boothman Verna M
Home Financials for this Owner
Home Financials are based on the most recent Mortgage that was taken out on this home.
Original Mortgage
$280,000
Interest Rate
4.25%
Create a Home Valuation Report for This Property
The Home Valuation Report is an in-depth analysis detailing your home's value as well as a comparison with similar homes in the area
Home Values in the Area
Average Home Value in this Area
Purchase History
| Date | Buyer | Sale Price | Title Company |
|---|---|---|---|
| Carpenter Larry Scott | -- | None Available | |
| Carpenter Larry Scott | $370,000 | Commonwealth Land Title Ins | |
| Walker Eleanore F | $370,000 | Commonwealth Land Title Ins | |
| Boothman Kent P | $350,000 | -- |
Source: Public Records
Mortgage History
| Date | Status | Borrower | Loan Amount |
|---|---|---|---|
| Closed | Carpenter Larry Scott | $296,000 | |
| Previous Owner | Boothman Kent P | $280,000 |
Source: Public Records
Tax History
| Year | Tax Paid | Tax Assessment Tax Assessment Total Assessment is a certain percentage of the fair market value that is determined by local assessors to be the total taxable value of land and additions on the property. | Land | Improvement |
|---|---|---|---|---|
| 2025 | $14,416 | $2,184,900 | $1,224,000 | $960,900 |
| 2024 | $14,416 | $2,026,200 | $1,111,100 | $915,100 |
| 2023 | $13,205 | $1,923,200 | $1,021,200 | $902,000 |
| 2022 | $12,780 | $1,530,300 | $764,700 | $765,600 |
| 2020 | $11,938 | $1,278,400 | $651,100 | $627,300 |
| 2019 | $11,337 | $1,222,900 | $633,800 | $589,100 |
| 2018 | $11,391 | $1,061,600 | $535,900 | $525,700 |
| 2017 | $10,008 | $975,900 | $483,000 | $492,900 |
| 2016 | $9,235 | $892,200 | $420,000 | $472,200 |
Source: Public Records
Map
Nearby Homes
- 217 9th Ave S
- 926 Dayton St
- 640 Bell St
- 712 Alder St
- 816 Walnut St
- 647 9th Ave N
- 1021 Walnut St
- 624 Alder St
- 621 Daley St
- 609 7th Ave N Unit B304
- 603 7th Ave N Unit A306
- 9533 Bowdoin Way
- 546 Walnut St Unit 201
- 910 9th Ave N
- 505 5th Ave S Unit 205
- 902 7th Ave S
- 233 3rd Ave S Unit 305
- 614 5th Ave S Unit C101
- 614 5th Ave S Unit C107
- 654 5th Ave S Unit 404
Your Personal Tour Guide
Ask me questions while you tour the home.