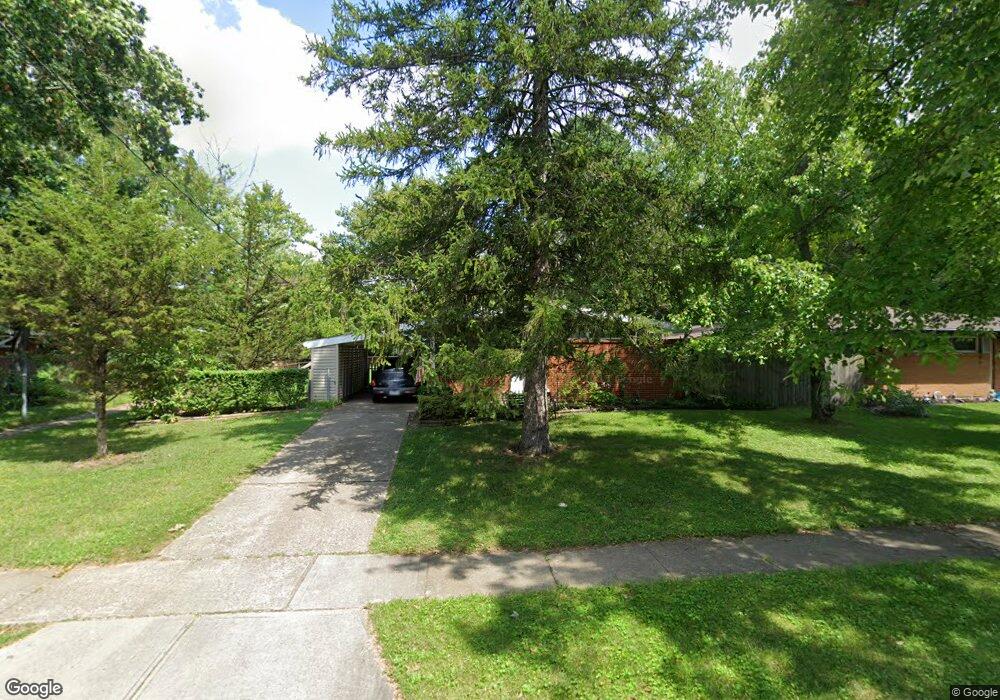
830 Cascade Rd Cincinnati, OH 45240
Estimated Value: $175,000 - $199,000
3
Beds
2
Baths
1,224
Sq Ft
$150/Sq Ft
Est. Value
About This Home
This home is located at 830 Cascade Rd, Cincinnati, OH 45240 and is currently estimated at $183,257, approximately $149 per square foot. 830 Cascade Rd is a home located in Hamilton County with nearby schools including Calvary Academy- The.
Ownership History
Date
Name
Owned For
Owner Type
Purchase Details
Closed on
Jul 16, 1990
Sold by
Torbeck Richard L
Bought by
Treaster David B
Current Estimated Value
Create a Home Valuation Report for This Property
The Home Valuation Report is an in-depth analysis detailing your home's value as well as a comparison with similar homes in the area
Home Values in the Area
Average Home Value in this Area
Purchase History
| Date | Buyer | Sale Price | Title Company |
|---|---|---|---|
| Treaster David B | $55,000 | -- |
Source: Public Records
Tax History
| Year | Tax Paid | Tax Assessment Tax Assessment Total Assessment is a certain percentage of the fair market value that is determined by local assessors to be the total taxable value of land and additions on the property. | Land | Improvement |
|---|---|---|---|---|
| 2025 | $1,690 | $38,857 | $9,282 | $29,575 |
| 2024 | $1,653 | $38,857 | $9,282 | $29,575 |
| 2023 | $1,722 | $38,857 | $9,282 | $29,575 |
| 2022 | $1,235 | $24,889 | $8,257 | $16,632 |
| 2021 | $1,189 | $24,889 | $8,257 | $16,632 |
| 2020 | $1,221 | $24,889 | $8,257 | $16,632 |
| 2019 | $1,028 | $20,741 | $6,881 | $13,860 |
| 2018 | $1,031 | $20,741 | $6,881 | $13,860 |
| 2017 | $983 | $20,741 | $6,881 | $13,860 |
| 2016 | $1,048 | $21,361 | $7,263 | $14,098 |
| 2015 | $981 | $21,361 | $7,263 | $14,098 |
| 2014 | $906 | $21,361 | $7,263 | $14,098 |
| 2013 | $967 | $22,484 | $7,644 | $14,840 |
Source: Public Records
Map
Nearby Homes
- 16 Japonica Dr
- 1 Jennings Rd
- 38 Handel Ln
- 37 Hayden Dr
- 602 Brightview Place Unit 34
- 612 Brightview Place Unit 30
- 614 Brightview Place Unit 29
- 626 Brightview Place Unit 24
- 622 Brightview Place Unit 26
- 620 Brightview Place Unit 27
- 624 Brightview Place Unit 25
- 564 Waycross Rd
- 34 Gambier Cir
- 1013 Ligorio Ave
- 920 Waycross Rd
- 31 Flanders Ln
- 11 Dewitt Ct
- 9 Dewitt Ct
- 6 Chalmers Ct
- 7 Dewitt Ct
- 828 Cascade Rd
- 832 Cascade Rd
- 10877 Carnegie Dr
- 826 Cascade Rd
- 10869 Carnegie Dr
- 10885 Carnegie Dr
- 834 Cascade Rd
- 829 Cascade Rd
- 10861 Carnegie Dr
- 831 Cascade Rd
- 827 Cascade Rd
- 10891 Carnegie Dr
- 833 Cascade Rd
- 836 Cascade Rd
- 825 Cascade Rd
- 10857 Carnegie Dr
- 10899 Carnegie Dr
- 822 Cascade Rd
- 823 Cascade Rd
- 10849 Carnegie Dr
Your Personal Tour Guide
Ask me questions while you tour the home.