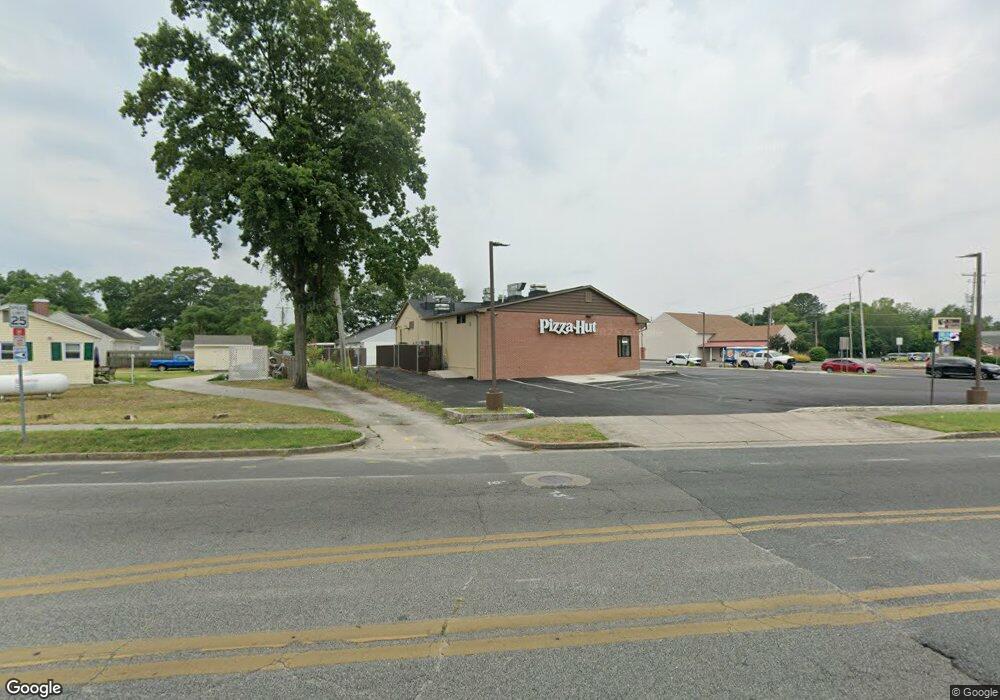
830 E Main St Salisbury, MD 21804
East Main Street NeighborhoodEstimated Value: $902,173
Studio
--
Bath
2,400
Sq Ft
$376/Sq Ft
Est. Value
About This Home
This home is located at 830 E Main St, Salisbury, MD 21804 and is currently estimated at $902,173, approximately $375 per square foot. 830 E Main St is a home located in Wicomico County with nearby schools including Charles H. Chipman Elementary School, Glen Avenue Elementary School, and Wicomico Middle School.
Ownership History
Date
Name
Owned For
Owner Type
Purchase Details
Closed on
May 8, 2013
Sold by
Ro Z Salisbury Llc
Bought by
Sierra Mike One Llc and Sierra Mike Two Llc
Current Estimated Value
Purchase Details
Closed on
Apr 19, 2012
Sold by
East Main Street Llc
Bought by
Ro Z Salisbury Llc
Purchase Details
Closed on
Jun 30, 2005
Sold by
O'Leary Company
Bought by
830 East Main Street Llc
Purchase Details
Closed on
May 8, 1997
Sold by
East Main Street Associates
Bought by
O'Leary Company
Create a Home Valuation Report for This Property
The Home Valuation Report is an in-depth analysis detailing your home's value as well as a comparison with similar homes in the area
Home Values in the Area
Average Home Value in this Area
Purchase History
| Date | Buyer | Sale Price | Title Company |
|---|---|---|---|
| Sierra Mike One Llc | $1,055,000 | First American Title Ins Co | |
| Ro Z Salisbury Llc | $450,000 | First American Title Ins Co | |
| 830 East Main Street Llc | -- | -- | |
| O'Leary Company | $294,000 | -- |
Source: Public Records
Tax History
| Year | Tax Paid | Tax Assessment Tax Assessment Total Assessment is a certain percentage of the fair market value that is determined by local assessors to be the total taxable value of land and additions on the property. | Land | Improvement |
|---|---|---|---|---|
| 2025 | $5,293 | $579,200 | $226,800 | $352,400 |
| 2024 | $5,417 | $564,967 | $0 | $0 |
| 2023 | $5,445 | $550,733 | $0 | $0 |
| 2022 | $5,467 | $536,500 | $340,200 | $196,300 |
| 2021 | $5,485 | $536,500 | $340,200 | $196,300 |
| 2020 | $5,533 | $536,500 | $340,200 | $196,300 |
| 2019 | $7,043 | $672,900 | $340,200 | $332,700 |
| 2018 | $13,752 | $672,900 | $340,200 | $332,700 |
| 2017 | $14,268 | $672,900 | $0 | $0 |
| 2016 | -- | $705,000 | $0 | $0 |
| 2015 | $3,789 | $596,900 | $0 | $0 |
| 2014 | $3,789 | $488,800 | $0 | $0 |
Source: Public Records
Map
Nearby Homes
- 228 Glen Ave
- 201 Marshall St
- 204 Holland Ave
- 113 Priscilla St Unit 1
- 812 E Church St
- 722 S Park Dr
- 309 Marshall St
- 309 Park Heights Ave
- 322 Naylor St
- 411 Elizabeth St
- 410 Elizabeth St
- 406 Hammond St
- 0 Civic Avenue & Beaglin Park Dr
- 430 Priscilla St
- 1209 Belmont Ave
- 500 E Vine St
- 923 Preston St
- 405 Washington St
- 304 Poplar Hill Ave
- 508 Christopher St
Your Personal Tour Guide
Ask me questions while you tour the home.