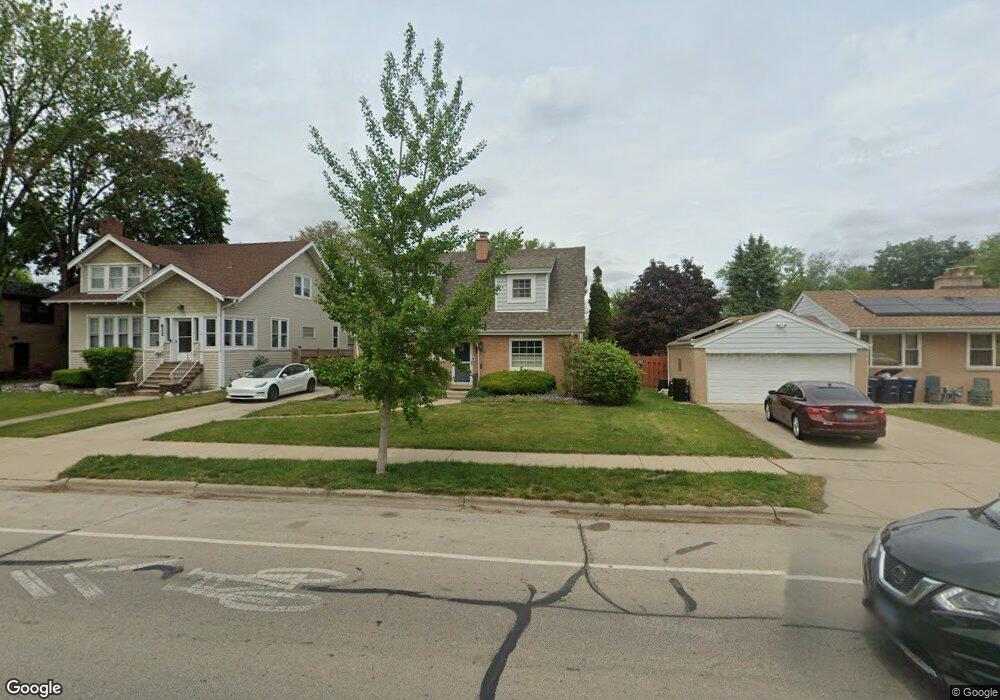
830 E Thacker St Des Plaines, IL 60016
Estimated Value: $433,000 - $507,000
4
Beds
3
Baths
2,240
Sq Ft
$209/Sq Ft
Est. Value
About This Home
This home is located at 830 E Thacker St, Des Plaines, IL 60016 and is currently estimated at $468,505, approximately $209 per square foot. 830 E Thacker St is a home located in Cook County with nearby schools including Forest Elementary School, Algonquin Middle School, and Maine West High School.
Ownership History
Date
Name
Owned For
Owner Type
Purchase Details
Closed on
Oct 14, 2016
Sold by
Tomsic Christina A
Bought by
Tomsic Chris and Chris Tomsic Trust
Current Estimated Value
Purchase Details
Closed on
May 18, 2016
Sold by
Tomsic Frank C and Tomsic Christina A
Bought by
Tomsic Christina
Home Financials for this Owner
Home Financials are based on the most recent Mortgage that was taken out on this home.
Original Mortgage
$402,800
Outstanding Balance
$322,556
Interest Rate
4.09%
Mortgage Type
New Conventional
Estimated Equity
$145,949
Purchase Details
Closed on
Jul 24, 2000
Sold by
Roach Nathalie C and Jones Margaret Lucille
Bought by
Tomsic Frank C and Tomsic Christina A
Home Financials for this Owner
Home Financials are based on the most recent Mortgage that was taken out on this home.
Original Mortgage
$120,000
Interest Rate
8.5%
Create a Home Valuation Report for This Property
The Home Valuation Report is an in-depth analysis detailing your home's value as well as a comparison with similar homes in the area
Home Values in the Area
Average Home Value in this Area
Purchase History
| Date | Buyer | Sale Price | Title Company |
|---|---|---|---|
| Tomsic Chris | -- | Attorney | |
| Tomsic Christina | -- | Attorney | |
| Tomsic Frank C | $150,000 | -- |
Source: Public Records
Mortgage History
| Date | Status | Borrower | Loan Amount |
|---|---|---|---|
| Open | Tomsic Christina | $402,800 | |
| Closed | Tomsic Frank C | $120,000 | |
| Closed | Tomsic Frank C | $16,875 |
Source: Public Records
Tax History
| Year | Tax Paid | Tax Assessment Tax Assessment Total Assessment is a certain percentage of the fair market value that is determined by local assessors to be the total taxable value of land and additions on the property. | Land | Improvement |
|---|---|---|---|---|
| 2025 | $8,090 | $42,000 | $6,817 | $35,183 |
| 2024 | $8,090 | $34,001 | $5,681 | $28,320 |
| 2023 | $7,868 | $34,001 | $5,681 | $28,320 |
| 2022 | $7,868 | $34,001 | $5,681 | $28,320 |
| 2021 | $8,957 | $32,468 | $4,544 | $27,924 |
| 2020 | $8,085 | $32,468 | $4,544 | $27,924 |
| 2019 | $8,786 | $36,076 | $4,544 | $31,532 |
| 2018 | $8,085 | $30,468 | $3,976 | $26,492 |
| 2017 | $7,959 | $30,468 | $3,976 | $26,492 |
| 2016 | $7,773 | $30,468 | $3,976 | $26,492 |
| 2015 | $7,654 | $27,941 | $3,408 | $24,533 |
| 2014 | $7,509 | $27,941 | $3,408 | $24,533 |
| 2013 | $7,304 | $27,941 | $3,408 | $24,533 |
Source: Public Records
Map
Nearby Homes
- 886 E Thacker St
- 652 E Prairie Ave
- 980 W Grant Dr
- 584 S 4th Ave
- 1107 E Prairie Ave
- 556 Orchard Ct
- 1048 E Walnut Ave
- 1005 Woodlawn Ave
- 1162 W Grant Dr
- 508 Crestwood Dr
- 674 E Algonquin Rd
- 890 North Ave
- 1122 Alfini Dr
- 1277 E Thacker St Unit 303
- 1205 S Wolf Rd
- 799 Graceland Ave Unit 404A
- 787 Graceland Ave Unit 202B
- 373 Woodbridge St
- 900 Center St Unit 3A
- 390 S Western Ave Unit 706
- 822 E Thacker St
- 840 E Thacker St
- 840 E Thacker St
- 810 E Thacker St
- 850 E Thacker St
- 827 Rose Ave
- 835 Rose Ave
- 819 Rose Ave
- 803 Rose Ave
- 845 Rose Ave
- 860 E Thacker St
- 831 E Thacker St
- 839 E Thacker St
- 857 Rose Ave
- 815 E Thacker St
- 870 E Thacker St
- 790 E Thacker St
- 805 E Thacker St
- 865 Rose Ave
- 861 E Thacker St
Your Personal Tour Guide
Ask me questions while you tour the home.