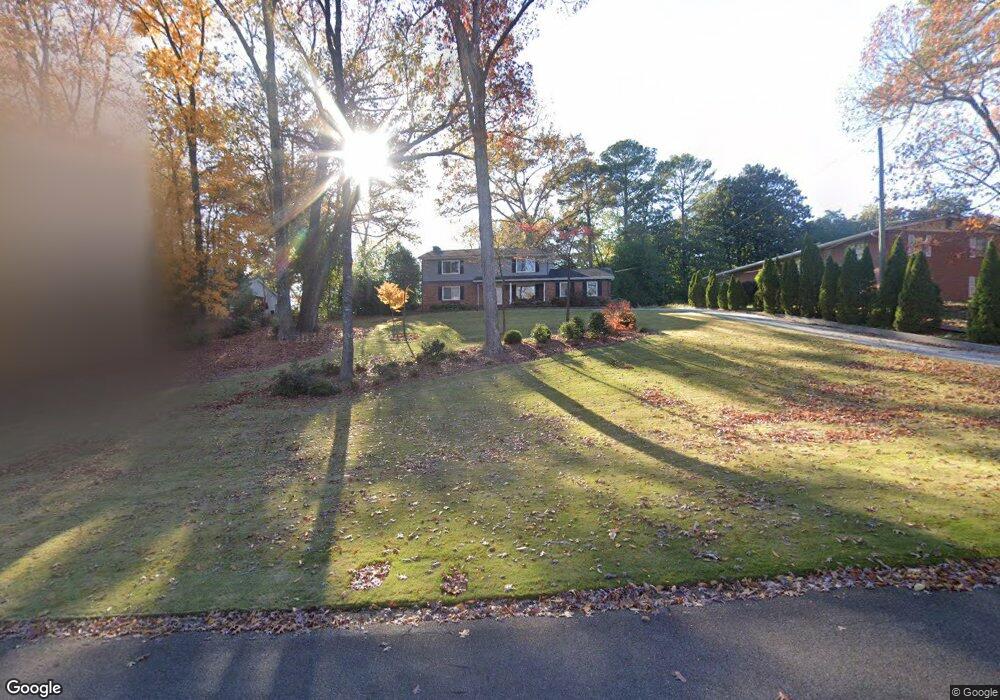
830 Glenairy Dr NE Unit 1 Atlanta, GA 30328
Estimated Value: $720,352 - $827,000
4
Beds
3
Baths
2,352
Sq Ft
$336/Sq Ft
Est. Value
About This Home
This home is located at 830 Glenairy Dr NE Unit 1, Atlanta, GA 30328 and is currently estimated at $790,338, approximately $336 per square foot. 830 Glenairy Dr NE Unit 1 is a home located in Fulton County with nearby schools including High Point Elementary School, Ridgeview Charter School, and Riverwood International Charter School.
Ownership History
Date
Name
Owned For
Owner Type
Purchase Details
Closed on
Dec 30, 2021
Sold by
Maier Ralf
Bought by
Maier Julie L
Current Estimated Value
Purchase Details
Closed on
May 13, 2002
Sold by
Lowden John R and Lowden Sheila A
Bought by
Christenson Julie L
Home Financials for this Owner
Home Financials are based on the most recent Mortgage that was taken out on this home.
Original Mortgage
$256,000
Interest Rate
6.92%
Mortgage Type
New Conventional
Purchase Details
Closed on
Jul 28, 1994
Sold by
Haley Eugene T
Bought by
Lowden John R Sheila A
Home Financials for this Owner
Home Financials are based on the most recent Mortgage that was taken out on this home.
Original Mortgage
$148,950
Interest Rate
7.75%
Create a Home Valuation Report for This Property
The Home Valuation Report is an in-depth analysis detailing your home's value as well as a comparison with similar homes in the area
Home Values in the Area
Average Home Value in this Area
Purchase History
| Date | Buyer | Sale Price | Title Company |
|---|---|---|---|
| Maier Julie L | -- | -- | |
| Maier Julie L | -- | -- | |
| Christenson Julie L | $320,000 | -- | |
| Lowden John R Sheila A | $165,500 | -- |
Source: Public Records
Mortgage History
| Date | Status | Borrower | Loan Amount |
|---|---|---|---|
| Previous Owner | Christenson Julie L | $256,000 | |
| Previous Owner | Christenson Julie L | $32,000 | |
| Previous Owner | Lowden John R Sheila A | $148,950 |
Source: Public Records
Tax History Compared to Growth
Tax History
| Year | Tax Paid | Tax Assessment Tax Assessment Total Assessment is a certain percentage of the fair market value that is determined by local assessors to be the total taxable value of land and additions on the property. | Land | Improvement |
|---|---|---|---|---|
| 2025 | $6,896 | $225,400 | $47,960 | $177,440 |
| 2023 | $6,309 | $223,520 | $47,960 | $175,560 |
| 2022 | $4,836 | $223,520 | $47,960 | $175,560 |
| 2021 | $6,053 | $217,040 | $46,600 | $170,440 |
| 2020 | $4,835 | $214,440 | $46,040 | $168,400 |
| 2019 | $4,758 | $210,640 | $45,200 | $165,440 |
| 2018 | $5,265 | $188,000 | $50,760 | $137,240 |
| 2017 | $4,706 | $151,960 | $43,800 | $108,160 |
| 2016 | $4,675 | $151,960 | $43,800 | $108,160 |
| 2015 | $4,689 | $151,960 | $43,800 | $108,160 |
| 2014 | $4,278 | $133,960 | $43,080 | $90,880 |
Source: Public Records
Map
Nearby Homes
- 6277 Mount Vernon Oaks Dr
- 370 the Chace NE
- 6350 Glen Oaks Ln
- 250 the South Chace NE
- 433 the North Chace NE
- 484 Glenmanor Ct
- 6118 Barfield Rd NE
- 475 Mount Vernon Hwy NE Unit C220
- 475 Mount Vernon Hwy NE Unit A102
- 475 Mount Vernon Hwy NE Unit 211
- 475 Mount Vernon Hwy NE Unit C121
- 475 Mount Vernon Hwy NE Unit 226C
- 112 Austin Dr
- 404 Granville Ct Unit 404
- 432 Granville Ct NE
- 419 Granville Ct NE
- 775 Glenridge Close Dr NE
- 119 Granville Ct
- 820 Glenairy Dr NE Unit 1
- 840 Glenairy Dr NE Unit 1
- 0 Aberdeen Dr NE Unit 8848415
- 0 Aberdeen Dr NE Unit 3125539
- 0 Aberdeen Dr NE Unit 3181869
- 0 Aberdeen Dr NE Unit 3244922
- 0 Aberdeen Dr NE Unit 3251986
- 0 Aberdeen Dr NE Unit 7030178
- 0 Aberdeen Dr NE Unit 7194242
- 0 Aberdeen Dr NE Unit 7202282
- 0 Aberdeen Dr NE Unit 7228048
- 0 Aberdeen Dr NE Unit 7310832
- 0 Aberdeen Dr NE Unit 7348948
- 0 Aberdeen Dr NE Unit 7360311
- 0 Aberdeen Dr NE Unit 7526842
- 0 Aberdeen Dr NE Unit 8067367
- 0 Aberdeen Dr NE Unit 8129341
- 0 Aberdeen Dr NE Unit 8099436
- 810 Glenairy Dr NE
- 825 Glenairy Dr NE