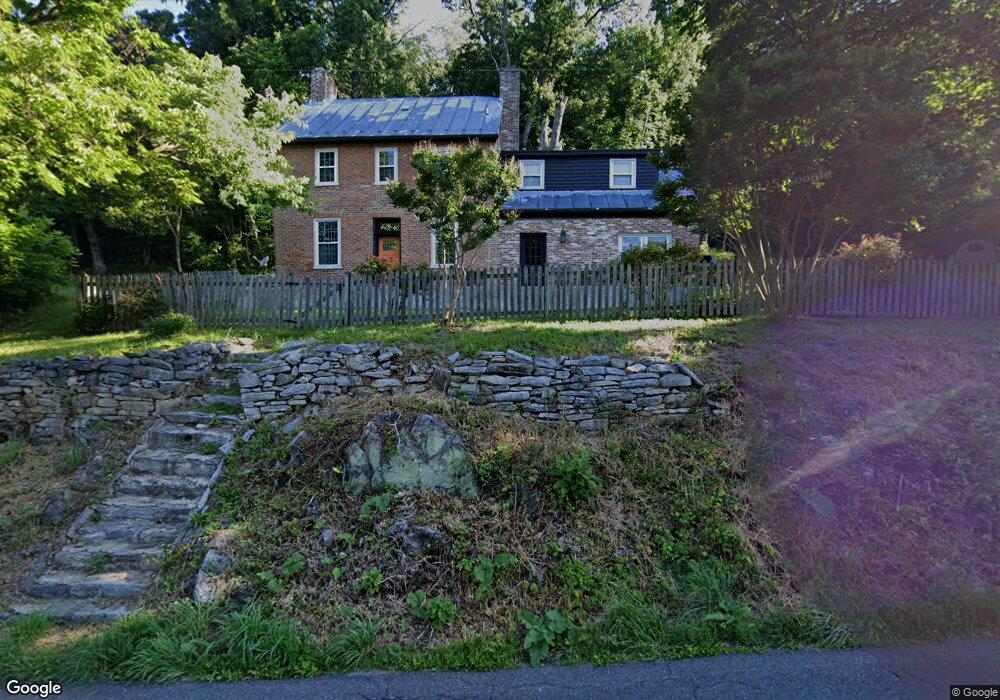
830 Green Spring Rd Winchester, VA 22603
Estimated Value: $497,836 - $596,000
3
Beds
2
Baths
1,987
Sq Ft
$282/Sq Ft
Est. Value
About This Home
This home is located at 830 Green Spring Rd, Winchester, VA 22603 and is currently estimated at $559,459, approximately $281 per square foot. 830 Green Spring Rd is a home located in Frederick County with nearby schools including Apple Pie Ridge Elementary School, Frederick County Middle School, and James Wood High School.
Ownership History
Date
Name
Owned For
Owner Type
Purchase Details
Closed on
Mar 18, 2025
Sold by
Zimmerman Wayne and Zimmerman Rhonda L
Bought by
Zimmerman Revocable Trust and Zimmerman
Current Estimated Value
Purchase Details
Closed on
Dec 10, 2007
Sold by
Harvey James C
Bought by
Zimmerman Wayne
Home Financials for this Owner
Home Financials are based on the most recent Mortgage that was taken out on this home.
Original Mortgage
$120,000
Interest Rate
6.3%
Mortgage Type
New Conventional
Purchase Details
Closed on
Mar 6, 2001
Sold by
Smith Charles D
Bought by
Harvey James C
Home Financials for this Owner
Home Financials are based on the most recent Mortgage that was taken out on this home.
Original Mortgage
$166,400
Interest Rate
7.15%
Create a Home Valuation Report for This Property
The Home Valuation Report is an in-depth analysis detailing your home's value as well as a comparison with similar homes in the area
Home Values in the Area
Average Home Value in this Area
Purchase History
| Date | Buyer | Sale Price | Title Company |
|---|---|---|---|
| Zimmerman Revocable Trust | -- | None Listed On Document | |
| Zimmerman Wayne | $320,000 | -- | |
| Harvey James C | $184,900 | -- |
Source: Public Records
Mortgage History
| Date | Status | Borrower | Loan Amount |
|---|---|---|---|
| Previous Owner | Zimmerman Wayne | $120,000 | |
| Previous Owner | Harvey James C | $166,400 |
Source: Public Records
Tax History
| Year | Tax Paid | Tax Assessment Tax Assessment Total Assessment is a certain percentage of the fair market value that is determined by local assessors to be the total taxable value of land and additions on the property. | Land | Improvement |
|---|---|---|---|---|
| 2025 | $1,746 | $363,820 | $105,600 | $258,220 |
| 2024 | $756 | $296,400 | $87,100 | $209,300 |
| 2023 | $1,512 | $296,400 | $87,100 | $209,300 |
| 2022 | $1,549 | $253,900 | $78,400 | $175,500 |
| 2021 | $1,549 | $253,900 | $78,400 | $175,500 |
| 2020 | $1,442 | $236,400 | $78,400 | $158,000 |
| 2019 | $1,442 | $236,400 | $78,400 | $158,000 |
| 2018 | $1,272 | $208,600 | $78,400 | $130,200 |
| 2017 | $1,252 | $208,600 | $78,400 | $130,200 |
| 2016 | $1,087 | $181,200 | $65,700 | $115,500 |
| 2015 | $1,015 | $181,200 | $65,700 | $115,500 |
| 2014 | $525 | $174,800 | $65,700 | $109,100 |
Source: Public Records
Map
Nearby Homes
- 0 Frog Hollow Rd Unit LotWP001
- 0 Frog Hollow Rd
- 344 Frog Hollow Rd
- Lot 52A Keval Gyan Way
- Lot 1 Keval Gyan Way
- Lot 5 Keval Gyan Way
- Lot 12 Keval Gyan Way
- Lot 11 Keval Gyan Way
- 2411 Hunting Ridge Rd
- 181 Signal Ridge Ln
- 189 Babbs Mountain Rd
- 111 Babbs Mountain Rd
- 472 Mccubbin
- 196 Hodges Ln
- 0 Hodges Ln Unit LotWP016
- 0 Hodges Ln Unit LotWP017
- 0 Apple Pie Ridge Rd Unit VAFV2039276
- 148 Cedar Hill Ln
- 0 Dominion Rd Unit WVBE2048168
- Lot 69/70 Driftwood Dr
- 869 Green Spring Rd
- 805 Green Spring Rd
- 0 Country Road Estates Lot 4 Unit VAFV154944
- 110 Frog Hollow Rd
- 28B Frog Hollow Rd
- 5 Frog Hollow Rd
- 748 Green Spring Rd
- 4 Frog Hollow Rd
- 136 Frog Hollow Rd
- 4-8 Frog Hollow Rd
- 201 Frog Hollow Rd
- 2411 Cedar Grove Rd
- 170 Frog Hollow Rd
- 179 Misty Meadow Dr
- 721 Green Spring Rd
- 716 Green Spring Rd
- 152 Frog Hollow Rd
- 970 Green Spring Rd
- 216 Frog Hollow Rd
- 220 Frog Hollow Rd
Your Personal Tour Guide
Ask me questions while you tour the home.