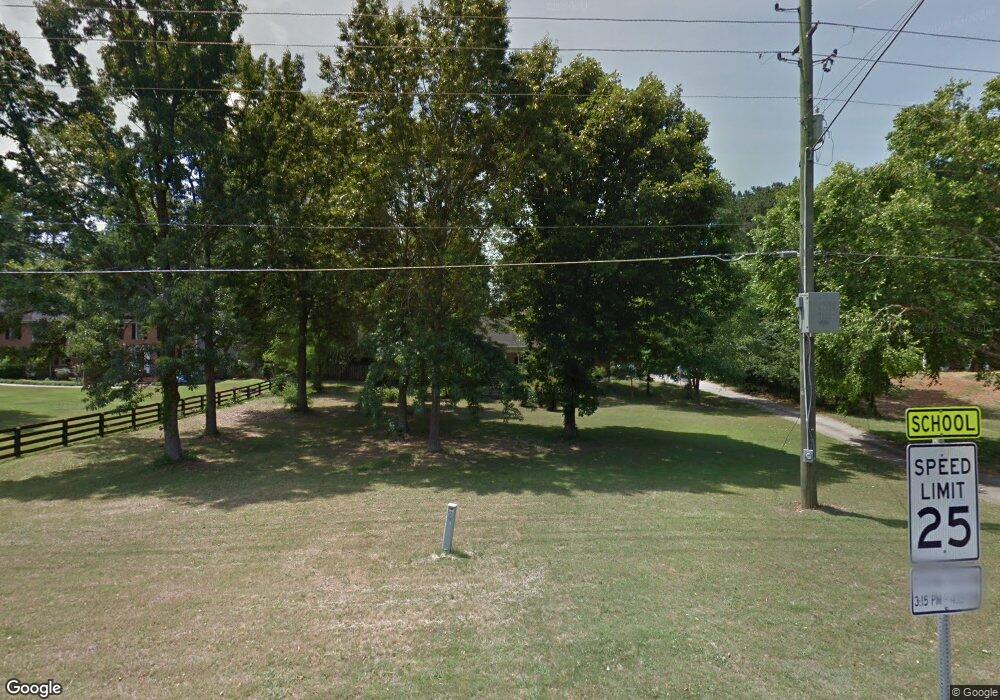
830 Hardscrabble Rd Roswell, GA 30075
Estimated Value: $672,000 - $827,000
4
Beds
3
Baths
2,800
Sq Ft
$263/Sq Ft
Est. Value
About This Home
This home is located at 830 Hardscrabble Rd, Roswell, GA 30075 and is currently estimated at $735,128, approximately $262 per square foot. 830 Hardscrabble Rd is a home located in Fulton County with nearby schools including Mountain Park Elementary School, Crabapple Middle School, and Fellowship Christian School.
Ownership History
Date
Name
Owned For
Owner Type
Purchase Details
Closed on
Aug 2, 2002
Sold by
Henry Robert G and Henry Gayle
Bought by
Oconner Greg A
Current Estimated Value
Home Financials for this Owner
Home Financials are based on the most recent Mortgage that was taken out on this home.
Original Mortgage
$185,000
Outstanding Balance
$77,947
Interest Rate
6.49%
Mortgage Type
New Conventional
Estimated Equity
$657,181
Purchase Details
Closed on
Feb 29, 2000
Sold by
Henry Robert G
Bought by
Henry Robert G and Henry Gayle
Home Financials for this Owner
Home Financials are based on the most recent Mortgage that was taken out on this home.
Original Mortgage
$164,000
Interest Rate
8.29%
Mortgage Type
New Conventional
Purchase Details
Closed on
Dec 22, 1993
Sold by
Chatham Kenneth W
Bought by
Orr Elizabeth Gail
Home Financials for this Owner
Home Financials are based on the most recent Mortgage that was taken out on this home.
Original Mortgage
$112,500
Interest Rate
7.13%
Create a Home Valuation Report for This Property
The Home Valuation Report is an in-depth analysis detailing your home's value as well as a comparison with similar homes in the area
Home Values in the Area
Average Home Value in this Area
Purchase History
| Date | Buyer | Sale Price | Title Company |
|---|---|---|---|
| Oconner Greg A | $250,000 | -- | |
| Henry Robert G | -- | -- | |
| Henry Robert G | $205,000 | -- | |
| Orr Elizabeth Gail | $150,000 | -- |
Source: Public Records
Mortgage History
| Date | Status | Borrower | Loan Amount |
|---|---|---|---|
| Open | Oconner Greg A | $185,000 | |
| Previous Owner | Henry Robert G | $164,000 | |
| Previous Owner | Orr Elizabeth Gail | $112,500 |
Source: Public Records
Tax History Compared to Growth
Tax History
| Year | Tax Paid | Tax Assessment Tax Assessment Total Assessment is a certain percentage of the fair market value that is determined by local assessors to be the total taxable value of land and additions on the property. | Land | Improvement |
|---|---|---|---|---|
| 2025 | $652 | $201,560 | $47,800 | $153,760 |
| 2023 | $5,450 | $193,080 | $75,200 | $117,880 |
| 2022 | $3,052 | $161,040 | $31,120 | $129,920 |
| 2021 | $511 | $115,440 | $27,120 | $88,320 |
| 2020 | $3,211 | $110,840 | $31,480 | $79,360 |
| 2019 | $523 | $115,280 | $32,840 | $82,440 |
| 2018 | $2,836 | $112,560 | $32,080 | $80,480 |
| 2017 | $2,589 | $100,680 | $21,200 | $79,480 |
| 2016 | $2,588 | $100,680 | $21,200 | $79,480 |
| 2015 | $3,147 | $100,680 | $21,200 | $79,480 |
| 2014 | $2,389 | $90,680 | $27,360 | $63,320 |
Source: Public Records
Map
Nearby Homes
- 2512 Waters Edge Trail Unit 2512
- 570 Wheatridge Bluff
- 1111 Waters Edge Trail
- 3412 Waters Edge Trail
- 5210 Davenport Place
- 5407 Waters Edge Trail
- 4201 Village Green Dr
- 865 Ferncroft Ct
- 870 Hickory Oak Hollow
- 1005 Hedgerose Ln
- 680 Brookfield Pkwy Unit 1
- 4405 Village Green Dr
- 345 Chaffin Ridge Ct
- 125 Fortuna Ct
- 2404 Village Ln Unit 2404
- 11850 Chaffin Rd
- 1515 Elgaen Place Dr
- 6010 Claiborne Cove
- 2010 Stonehedge Rd
- 840 Hardscrabble Rd
- 850 Kingridge Dr
- 820 Hardscrabble Rd
- 845 Kingridge Dr
- 840 Brooksglen Dr Unit 18
- 835 Kingridge Dr
- 845 Brooksglen Dr
- 845 Brooksglen Dr Unit 18
- 840 Kingridge Dr
- 805 Hardscrabble Rd
- 850 Brooksglen Dr
- 220 Gabriel Dr
- 860 Hardscrabble Rd
- 830 Kingridge Dr
- 11650 King Rd
- 0 Kingridge Dr Unit 8859464
- 0 Kingridge Dr
- 860 Brooksglen Dr
- 865 Brooksglen Dr
- 805 Kingridge Dr