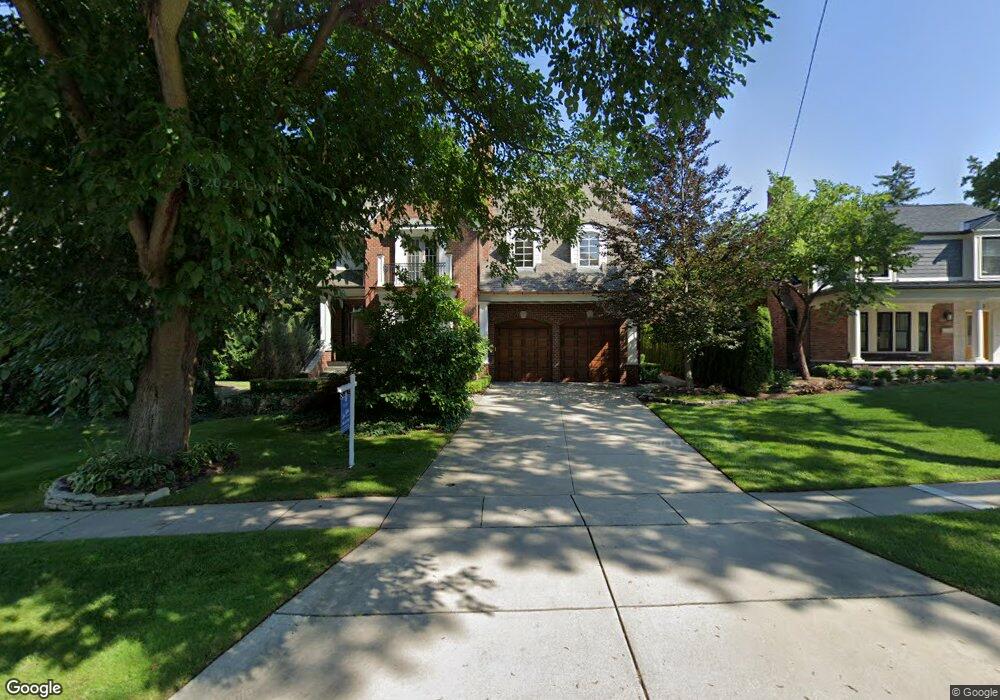
830 Harmon St Unit Bldg-Unit Birmingham, MI 48009
Estimated Value: $3,387,000 - $4,329,000
3
Beds
7
Baths
5,028
Sq Ft
$733/Sq Ft
Est. Value
About This Home
This home is located at 830 Harmon St Unit Bldg-Unit, Birmingham, MI 48009 and is currently estimated at $3,683,546, approximately $732 per square foot. 830 Harmon St Unit Bldg-Unit is a home located in Oakland County with nearby schools including Pierce Elementary School, Derby Middle School, and Ernest W. Seaholm High School.
Ownership History
Date
Name
Owned For
Owner Type
Purchase Details
Closed on
Oct 24, 2023
Sold by
Bailey Michael T and Bailey Edana H
Bought by
Acho Renee M Lossia
Current Estimated Value
Purchase Details
Closed on
Oct 9, 2018
Sold by
Adderley Mary Elizabeth and Mary Elizabeth Adderley Trust
Bought by
Bailey Michael T and Bailey Edana H
Purchase Details
Closed on
Dec 16, 2013
Sold by
Shannon Francis and Shannon Lora A
Bought by
Adderley Mary Elizabeth and Mary Elizabeth Adderley Trust
Purchase Details
Closed on
Apr 10, 2003
Sold by
Hermann Robert A and Hermann Clara M
Bought by
Hermann Robert A and Fisk Bonnie
Purchase Details
Closed on
Jun 18, 2002
Sold by
Trillium Companies Inc
Bought by
Shannon Francis
Purchase Details
Closed on
Aug 24, 2001
Sold by
C R A
Bought by
Trillium Companies Inc
Purchase Details
Closed on
May 17, 1999
Sold by
Potter William C
Bought by
A C R Co
Create a Home Valuation Report for This Property
The Home Valuation Report is an in-depth analysis detailing your home's value as well as a comparison with similar homes in the area
Home Values in the Area
Average Home Value in this Area
Purchase History
We collect this data history from publicly available records. To have your information removed, we recommend requesting removal directly through your county’s website.
| Date | Buyer | Sale Price | Title Company |
|---|---|---|---|
| Acho Renee M Lossia | -- | None Listed On Document | |
| Acho Renee M Lossia | -- | None Listed On Document | |
| Bailey Michael T | $1,500,000 | None Available | |
| Adderley Mary Elizabeth | -- | Interstate Title Inc | |
| Hermann Robert A | -- | None Available | |
| Shannon Francis | -- | -- | |
| Trillium Companies Inc | -- | -- | |
| A C R Co | $425,000 | -- |
Source: Public Records
Mortgage History
We collect this data history from publicly available records. To have your information removed, we recommend requesting removal directly through your county’s website.
| Date | Status | Borrower | Loan Amount |
|---|---|---|---|
| Closed | Trillium Companies Inc | -- |
Source: Public Records
Tax History
| Year | Tax Paid | Tax Assessment Tax Assessment Total Assessment is a certain percentage of the fair market value that is determined by local assessors to be the total taxable value of land and additions on the property. | Land | Improvement |
|---|---|---|---|---|
| 2025 | $33,017 | $1,195,310 | $0 | $0 |
| 2024 | $29,146 | $855,720 | $0 | $0 |
| 2023 | $27,986 | $816,620 | $0 | $0 |
| 2022 | $30,442 | $806,200 | $0 | $0 |
| 2021 | $30,711 | $763,850 | $0 | $0 |
| 2020 | $27,570 | $759,000 | $0 | $0 |
| 2019 | $31,212 | $745,160 | $0 | $0 |
| 2018 | $40,770 | $940,080 | $0 | $0 |
| 2017 | $36,247 | $937,790 | $0 | $0 |
| 2016 | $36,314 | $941,500 | $0 | $0 |
| 2015 | -- | $953,610 | $0 | $0 |
| 2014 | -- | $812,630 | $0 | $0 |
| 2011 | -- | $591,860 | $0 | $0 |
Source: Public Records
Map
Nearby Homes
- 592 Lakeside Dr
- 660 Dewey St
- 750 Hazelwood St
- 840 Lakeside Dr
- 850 Greenwood St
- 667 Oak Ave
- 723 N Old Woodward Ave
- 723 N Old Woodward Ave Unit 5
- 551 N Old Woodward Ave Unit 551
- 852 Puritan Ave
- 852a Puritan Ave
- 1035 N Old Woodward Ave
- 146 Puritan Ave
- 1077 N Old Woodward Ave
- 1075 N Old Woodward Ave
- 369 N Old Woodward Ave Unit 301
- 369 N Old Woodward Ave Unit 307
- 369 N Old Woodward Ave Unit 206
- 1115 N Old Woodward Ave Unit 66
- 1115 N Old Woodward Ave Unit 52
- 830 Harmon St
- 810 Harmon St
- 540 Lakeview Ave
- 555 Baldwin Ct
- 530 Lakeview Ave
- 550 Lakeview Ave
- 567 Baldwin Ct
- 788 Harmon St
- 560 Lakeview Ave
- 550 Baldwin Ct
- 0 Baldwin Unit 5389585
- 0 Baldwin Unit 5448420
- 0 Baldwin Unit 216056243
- 0 Baldwin Unit 213018481
- 0 Baldwin Unit R219000594
- 827 Harmon St
- 787 Harmon St
- 855 Harmon St Unit Bldg-Unit
- 855 Harmon St
- 590 Lakeview Ave
Your Personal Tour Guide
Ask me questions while you tour the home.