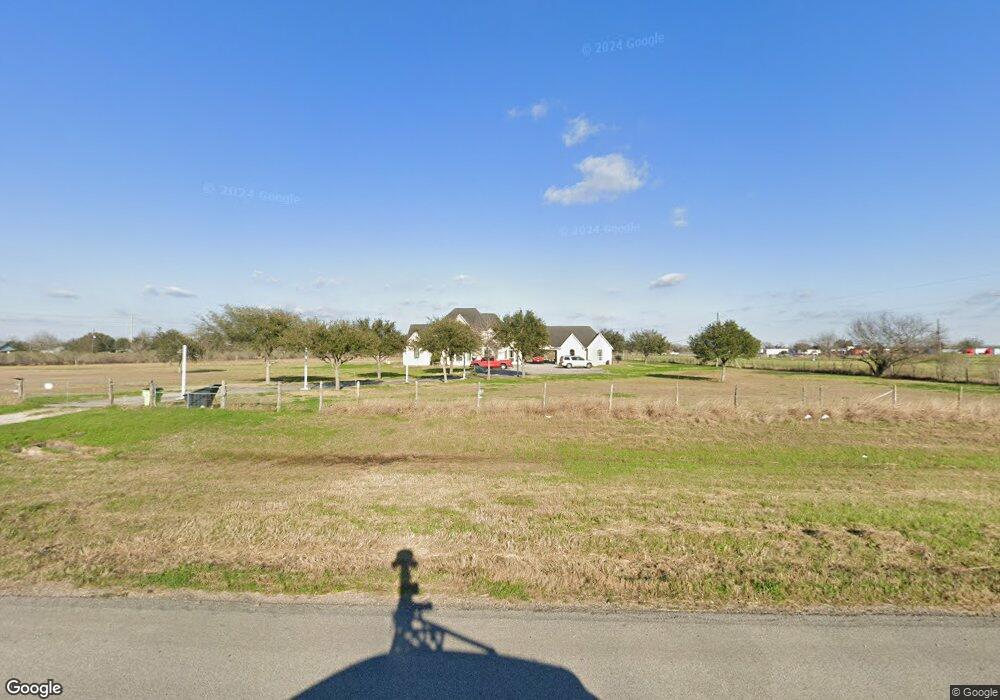
830 Highway 36 Bypass Rosenberg, TX 77471
Estimated Value: $982,000 - $1,613,243
4
Beds
6
Baths
4,800
Sq Ft
$270/Sq Ft
Est. Value
About This Home
This home is located at 830 Highway 36 Bypass, Rosenberg, TX 77471 and is currently estimated at $1,297,622, approximately $270 per square foot. 830 Highway 36 Bypass is a home located in Fort Bend County with nearby schools including Brazos Elementary School, Brazos Middle School, and Brazos High School.
Ownership History
Date
Name
Owned For
Owner Type
Purchase Details
Closed on
Jan 22, 2009
Sold by
Soto Rafael and Soto Anabel C
Bought by
Valadez Julia C
Current Estimated Value
Home Financials for this Owner
Home Financials are based on the most recent Mortgage that was taken out on this home.
Original Mortgage
$417,000
Outstanding Balance
$266,939
Interest Rate
5.42%
Mortgage Type
New Conventional
Estimated Equity
$1,030,683
Purchase Details
Closed on
Dec 4, 2008
Sold by
Compean Ramiro and Compean Dolores A
Bought by
Soto Ralph and Soto Anabel
Home Financials for this Owner
Home Financials are based on the most recent Mortgage that was taken out on this home.
Original Mortgage
$417,000
Outstanding Balance
$266,939
Interest Rate
5.42%
Mortgage Type
New Conventional
Estimated Equity
$1,030,683
Purchase Details
Closed on
May 14, 2004
Sold by
Richey L E Foundation Inc
Bought by
Valadez Julia C
Create a Home Valuation Report for This Property
The Home Valuation Report is an in-depth analysis detailing your home's value as well as a comparison with similar homes in the area
Home Values in the Area
Average Home Value in this Area
Purchase History
| Date | Buyer | Sale Price | Title Company |
|---|---|---|---|
| Valadez Julia C | -- | Universal Land Title | |
| Soto Ralph | -- | None Available | |
| Valadez Julia C | -- | -- |
Source: Public Records
Mortgage History
| Date | Status | Borrower | Loan Amount |
|---|---|---|---|
| Open | Valadez Julia C | $417,000 |
Source: Public Records
Tax History Compared to Growth
Tax History
| Year | Tax Paid | Tax Assessment Tax Assessment Total Assessment is a certain percentage of the fair market value that is determined by local assessors to be the total taxable value of land and additions on the property. | Land | Improvement |
|---|---|---|---|---|
| 2025 | $5,513 | $1,150,263 | $787,946 | $823,614 |
| 2024 | $5,513 | $1,045,694 | $398,526 | $647,168 |
| 2023 | $5,246 | $950,631 | $296,577 | $654,054 |
| 2022 | $4,856 | $864,210 | $342,260 | $521,950 |
| 2021 | $15,892 | $790,130 | $821,410 | $402,530 |
| 2020 | $14,519 | $701,750 | $821,410 | $383,200 |
| 2019 | $14,890 | $637,950 | $356,950 | $281,000 |
| 2018 | $13,693 | $579,950 | $356,950 | $223,000 |
| 2017 | $12,884 | $527,230 | $227,480 | $299,750 |
| 2016 | $13,084 | $535,410 | $227,480 | $307,930 |
| 2015 | $4,654 | $544,910 | $227,480 | $317,430 |
| 2014 | -- | $547,850 | $227,480 | $320,370 |
Source: Public Records
Map
Nearby Homes
- 3106 Spitfire
- 3418 Everglade Ln
- 4511 Whisperwood Dr
- 327 Afton Dr
- 518 Anton Stade Rd
- 1585 Patton Tx-10 Spur Rd
- 5443 Randon School Rd
- 7514 Dixon Rd
- 2245 Randon Dyer Rd
- 322 Big Pine Trail
- 0 Daily Rd Unit 41757180
- 131 Afton June Dr
- 315 Cottontail Ln
- 5006 Bowen Prairie Dr
- 110 Blue River Trail
- 3715 U S 59
- 111 Blue River Trail
- 5015 Bowen Prairie Dr
- 411 Big Pine Trail
- 5023 Bowen Prairie Dr
- 830 Highway 36 Bypass
- 4625 Randon School Rd
- 746 Highway 36 Bypass
- 4623 Randon School Rd
- 4525 Randon School Rd
- 4517 Randon School Rd
- 4517 Randon School Rd
- 736 Highway 36 Bypass
- 618 Highway 36 Bypass
- 618 Highway 36 Bypass
- 4509 Randon School Rd
- 4530 Randon School Rd
- 4311 Randon School Rd
- 4534 Randon School Rd
- 4428 Randon School Rd
- 1121 Patton Rd
- 4424 Randon School Rd
- 4502 Randon School Rd
- 807 S Miller Rd
- 0 Highway 36 Bypass